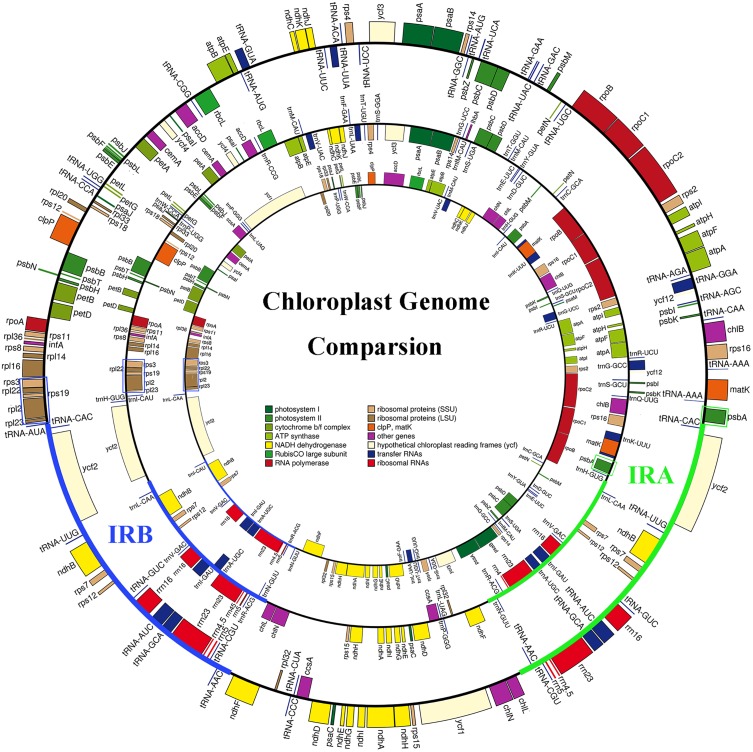
Fig 3. The G. pensilis cp genome lost IRA in comparison with G. biloba and C. revolute.
Outer to inner circles correspond to the cp genome maps of C. revolute, G. biloba and G. pensilis, respectively. The bold blue and green lines in the C. revolute and G. biloba cp genome circles correspond to the IRA and IRB regions, respectively. The blue solid boxes correspond to the rpl23-rps3 cluster, which is always downstream of the IRB region, and the green solid boxes correspond to psbA, which is always upstream of the IRA region in a clockwise direction.

