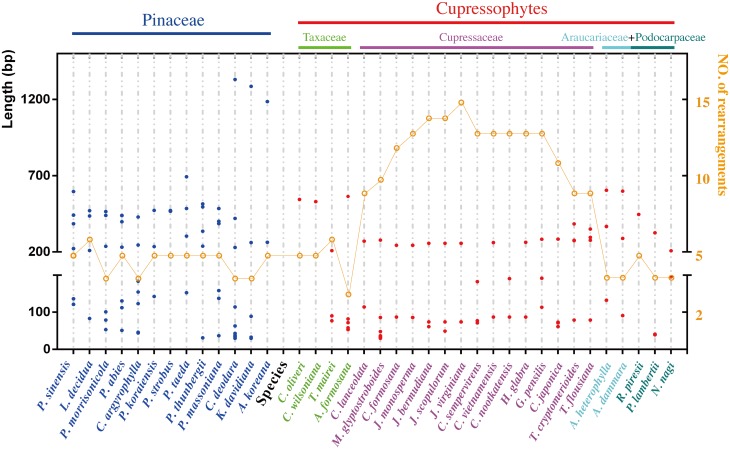
Fig 4. The distribution of palindromic repeats and estimated number of rearrangement events in conifer cp genomes.
The full binomial species names for the species in this figure are listed in S2 Table. Dots colored in blue and red belong to the Pinaceae and cupressophytes, respectively and represent a pair of palindromic repeats with the size of the repeat unit corresponding to the value on the left y-axis. Dots colored in orange represent the estimated number of rearrangement events required for transforming corresponding species cp genome into that of G.biloba and correspond to the value on the right y-axis.

