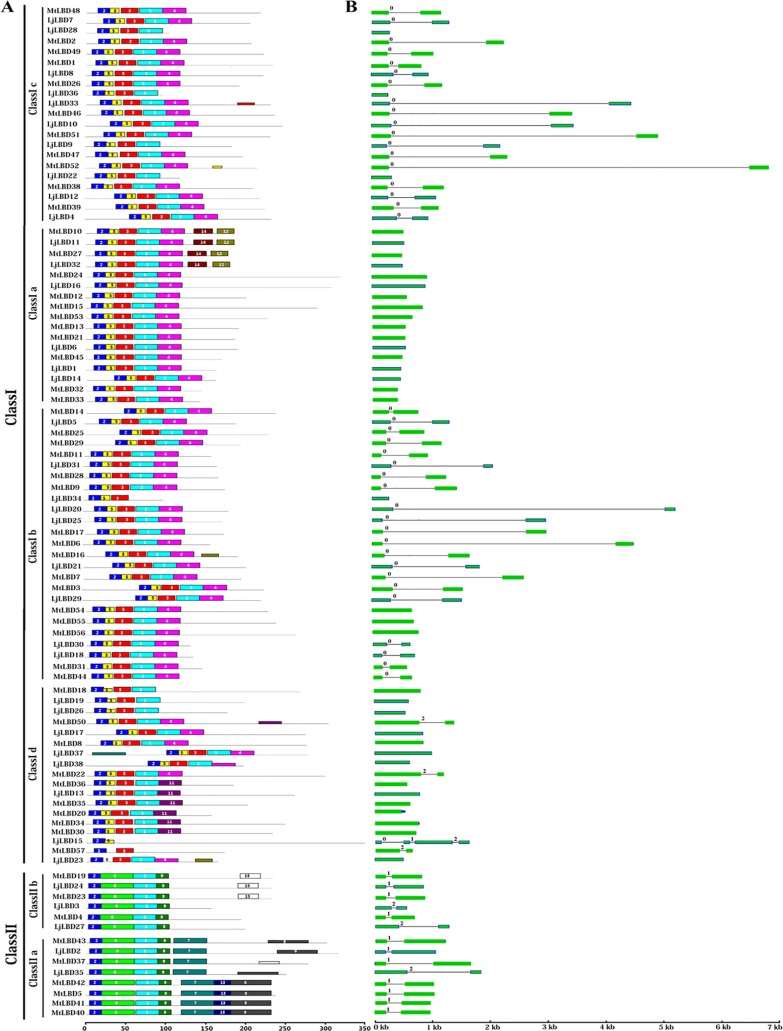
Fig 4. Distribution of conserved motifs and gene structure analysis of LBD gene family from Lotus japonicus and Medicago truncatula.
(A) Conserved motifs analysis by MEME suite. The colorful boxes represent the different motifs 1–15. (B) The exons and introns splicing patterns. The green boxes and black lines represent the exon ans intron, respectively. The numbers indicate the intron phase. The motifs and gene sizes are indicated at the bottom of the figure.

