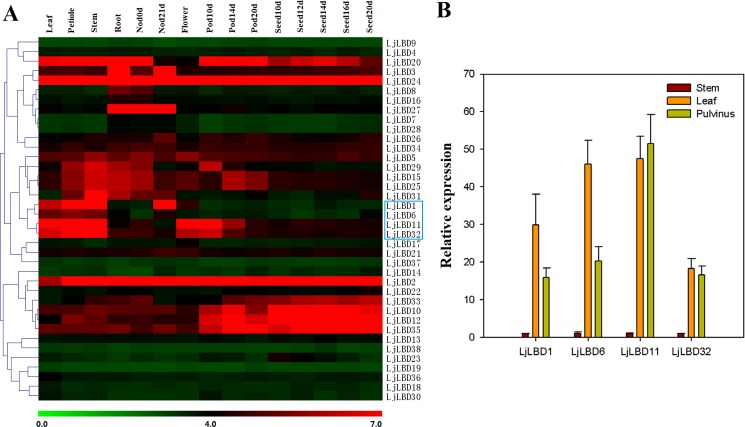
Fig 5. Expression profiles of LBD genes in Lotus japonicus.
(A) Heatmap showing LBD gene expression patterns in different tissues/organs/development stages. The scale at the bottom represents log2 value. (B) Some genes highly expressed in leaf (the blue box) were confirmed by quantitative RT-PCR. The expression level of stem sample was normalized to 1.

