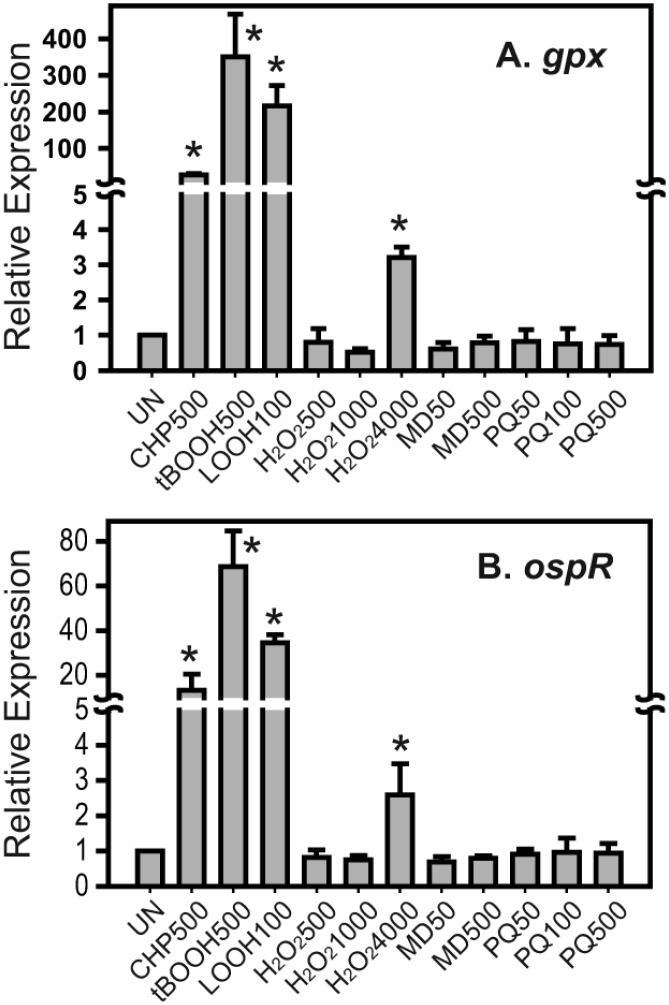
Fig 1. Expression analysis of gpx and ospR in the presence of oxidants.
Quantitative real-time PCR was performed to measure relative expression levels (2-ΔΔCt) of gpx (A) and ospR (B) in wild-type Pseudomonas aeruginosa with various oxidant treatments for 15 min. The uninduced sample was set to 1. UN, uninduced; CHP500, 500 μM CHP; tBOOH500, 500 μM tBOOH; LOOH100, 100 μM linoleic hydroperoxide; H2O2500, 500 μM H2O2; H2O21000, 1000 μM H2O2; H2O24000, 4000 μM H2O2; MD50, 50 μM menadione; MD500, 500 μM menadione; PQ50, 50 μM paraquat; PQ100, 100 μM paraquat; PQ500, 500 μM paraquat. Significant differences (P < 0.05) between the treated samples and uninduced sample are denoted with asterisks.

