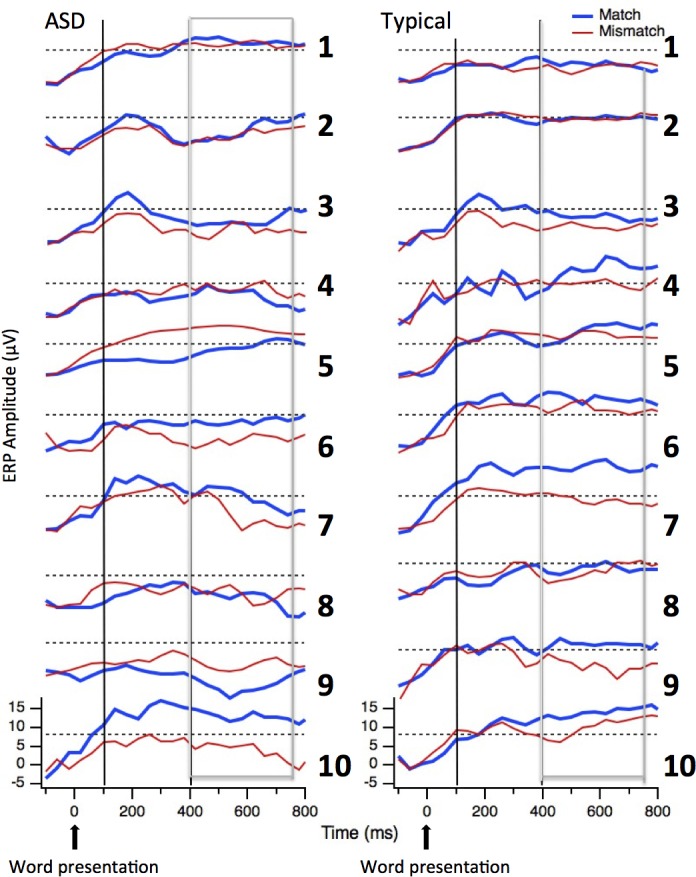
Fig 11. Individual ERP profiles for Auditory Evoked Potentials.

Individual ERP waveforms time-locked to the word for the two groups (ASD children on the left and Neurotypical children on the right) and the two conditions (Match in blue and Mismatch in red) in the Vertex array. The vertical lines indicate the expected latency for the auditory P1 peak and the boxes indicate the time-window where the N400 component is expected.
