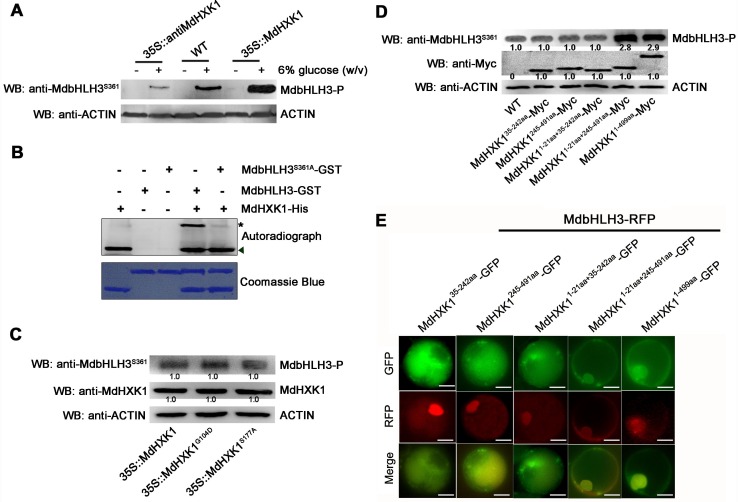
Fig 4. MdHXK1 mediates the glucose-induced phosphorylation of the MdbHLH3 protein.
(A) The glucose-induced MdbHLH3 phosphorylation was enhanced in the 35S::MdHXK1 overexpressing apple calli but inhibited in the 35S::antiMdHXK1 suppressing apple calli. (B) MdHXK1 in vitro phosphorylates MdbHLH3 but not MdbHLH3S361A. The kinase assay was initiated by adding radiolabeled ATP to the mixture of MdHXK1-His kinase and MdbHLH3-GST (or MdbHLH3S361A-GST). SDS-PAGE gel with coomassie blue-stained MdHXK1-His, MdbHLH3-GST and MdbHLH3S361A-GST proteins (bottom panel); autoradiograph showing MdbHLH3 phosphorylation by MdHXK1 (top panel, top band labeled with asterisk) and MdHXK1 autophosphorylation (top panel, bottom bands labeled with triangle). (C) Mutation G104D or S177A of the MdHXK1 protein does not affect its ability to phosphorylate MdbHLH3. The 35S::MdHXK1, 35S::MdHXK1G104D and 35S::MdHXK1S177A transgenic apple calli were used. Protein amounts were normalized based on the protein folds of the 35S::MdHXK1 transgenic apple calli. (D) Signal peptide and hexokinase_2 domain of MdHXK1 play a crucial role in the ability of MdHXK1 to phosphorylate the MdbHLH3 protein. The Myc-tag recombined vector plasmids of MdHXK135-242aa (hexokinase_1), MdHXK1245-491aa (hexokinase_2), MdHXK11-21aa+35-242aa (Signal peptide + hexokinase_1), MdHXK11-21aa+245-491aa (Signal peptide + hexokinase_2) and MdHXK11-499aa (Signal peptide + hexokinase_1 + hexokinase_2) were transformed into the WT apple calli. Protein amounts were normalized based on the protein folds of the WT control. (E) Co-localization analysis of the full-length or truncated mutants of MdHXK1-GFP and MdbHLH3-RFP in vivo. The full-length and truncated mutants of MdHXK1 as mentioned in (D) were fused to the green fluorescent protein (GFP) tag. The full-length MdbHLH3 was fused to the red fluorescent protein (RFP) tag. For each image, two constructs, as indicated, were transferred into protoplasts of apple calli cells and then analyzed using confocal microscopy. Yellow colors in the merged images indicate the co-localization of the two signals. Bars = 20 μm. Note: In (C) and (D), protein bands were quantified by scanning densitometry using a Hewlett Packard Scanjet scanner and Scanplot software. All of the protein amounts were normalized based on the protein folds of band 1.

