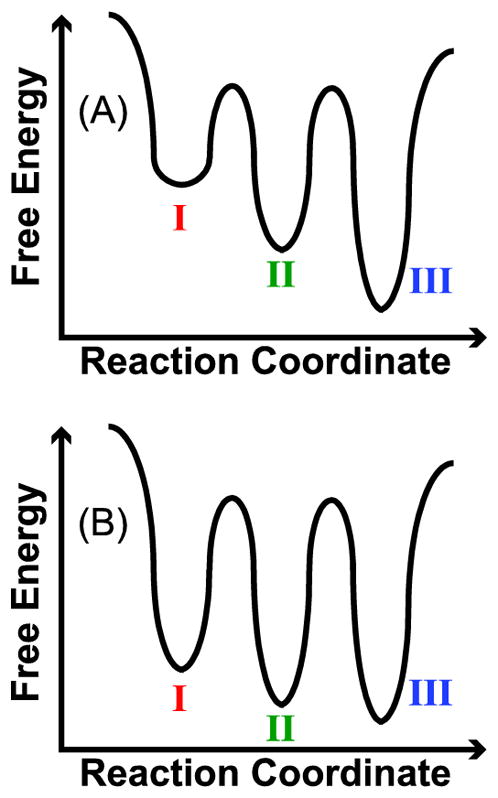
Figure 6.

(A) Qualitative reaction coordinate of 6→6* and 8→6* ubiquitin that is consistent with the post-CAPTR activation data shown in Figures 5A and 5B. The labels for the three wells correspond to features in the Ω distributions. (B) Qualitative reaction coordinate of 13→6* ubiquitin that is consistent with the post-CAPTR activation data shown in Figure 5C. Again, the labels for the wells correspond to the features in the Ω distributions; the post-CAPTR activation experiments indicate that the structures populated in the wells in B are different than those in A.
