
Figure 4.
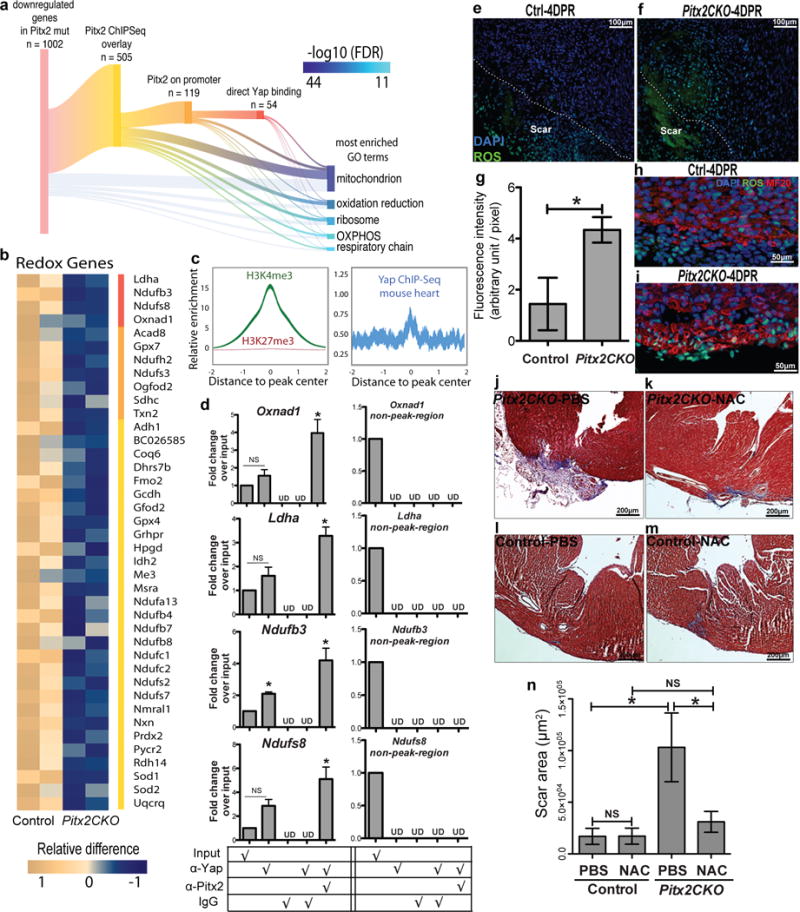
Pitx2 regulates redox balance in neonatal myocardium. (a) Sankey diagram shows direct target genes of Pitx2 from overlaying ChIP-Seq and RNA-Seq profiles. A subset of genes is further branched according to promoter binding activity of Pitx2 and Yap. Gene ontology analysis is performed on 1002 down-regulated genes in Pitx2CKO ventricles at 5 days after P1 resection. The GO terms are listed by significance in descending order. The branches indicate the source of genes for each term. OXPHOS, oxidative phosphorylation. (b) Heat map highlights mitochondrial genes directly targeted by Pitx2. Red bar, genes co-regulated by Pitx2 and Yap; orange, direct binding of Pitx2 on promoters. (c) Heart specific H3K4me3 ChIP-Seq and Yap ChIP-Seq read distribution with in 2 kb interval of promoter region of Pitx2 direct target genes. The width of the curve indicate 95% confidence interval. (d) ChIP-re-ChIP showing co-occupancy of Pitx2 and Yap at the regulatory regions of common target genes (in b, red bar), n=3. (e–i) ROS staining (green) of apical border zone in Pitx2CKO (f, i) and control (e, h), with fluorescent intensity quantified in g. MF20, red; DAPI, blue, n=4. (j–n) Trichrome at 21DPR showed apical scarring of Pitx2CKO (j, k) and control (l, m) hearts treated with PBS (j, l) or NAC (k, m), with scar area quantified in n, n=5. Mean ± S.E.M.; Statistical test, (n) one-way ANOVA plus Bonferroni post-test; (g) Mann-Whitney; (d) Mann-Whitney and Wilcoxon signed-rank test; *, p<0.05; NS, not significant.