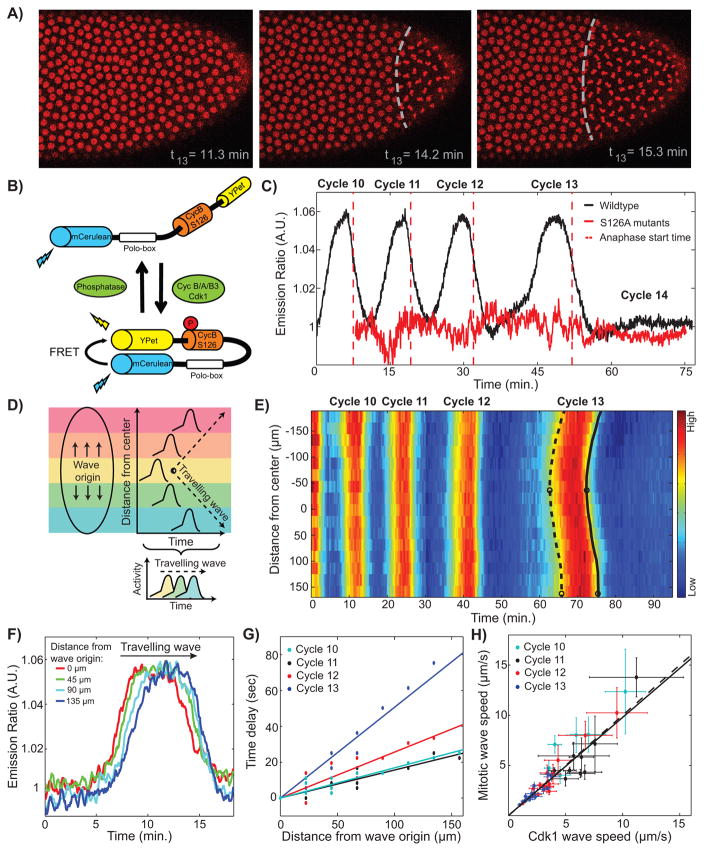
Figure 1. Cdk1 waves drive mitotic waves.
(A) Time lapse series depicting the propagation of a mitotic wave in an embryo with RFP-tagged histones. (B) Schematic view of the Cdk1 FRET biosensor composed of two fluorophores, YPet and mCerulean, which are linked by a Cdk1 phosphorylation site from cyclin B1 (S126) and the polo box domain of Plk1. Upon phosphorylation of the Cdk1-specific phosphorylation site, the sensor undergoes a conformational change that results in increased FRET efficiency. (C) Emission ratio of FRET sensor averaged across one embryo shows clear oscillations of Cdk1 activity, which increases upon mitotic entry and remains low during early interphase 14, when the levels of active Cdk1 are uniformly low. Red line, S126A mutant; red dotted line, average anaphase entry time. (D) Cdk1 traveling waves can be visualized by plotting the activity profiles as a function of space and time. First, images are divided into different regions along the anterior-posterior axis of the embryo (colored boxes). Activity profiles for each region are then calculated and plotted as a function of time and space, which allows for the visualization of the wave front (dotted line). (E) Heat-map of Cdk1 activity over time and along the anterior-posterior (AP)-axis of an embryo. White circles indicate wave origins at cycle 13, dotted line indicates the mitotic entry front and the black line indicates the anaphase wave front. (F) Cdk1 activity profiles for different positions along the AP-axis of an embryo in cell cycle 13. (G) The speed of the wave is estimated by computing the time elapsed for the wave to travel a given distance along the embryo: the inverse slope of a linear fit yields the speed. (H) Mitotic wave speed as a function of Cdk1 wave speed. Dotted line, identity line; solid line, best-fit curve. Scale-bars, 10μm. Error bars, 95% confidence interval (CI); a.u., arbitrary units. See also Figure S1 and Movies S1 and S2.

