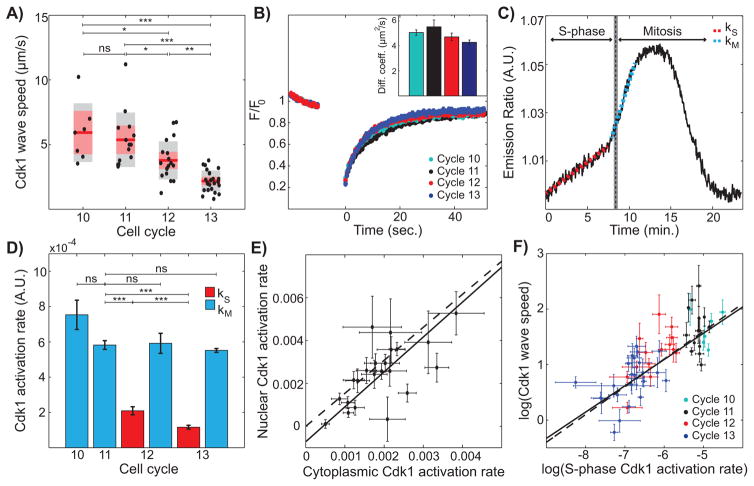
Figure 2. Cdk1 activity during S-phase is predictive of mitotic and Cdk1 wave speed.
(A) Cdk1 wave speed as a function of developmental cycles. Red line, mean; gray box, 95% CI; red box, 1 standard deviation (SD). (B) Normalized fluorescence intensity profile of YFP-tagged Cdk1 before and after photobleaching. Inset, calculated diffusion coefficient per cell cycle. Error bars, standard error of the mean (s.e.m.) (C) Emission ratio of Cdk1 sensor for cycle 13 displays biphasic behavior. Red dotted line corresponds to Cdk1 activation rate during S-phase (kS) and blue dotted line corresponds to Cdk1 activation rate during mitosis (kM). Completion of S-phase was determined through the disappearance of RFP-tagged PCNA foci, see Supplemental Information for details. (D) Average Cdk1 activation rate per cell cycle. Red bars, S-phase Cdk1 activation rate (kS); blue bars, mitotic Cdk1 activation rate (kM). Error bars, s.e.m. (E) Nuclear and cytoplasmic Cdk1 activities were calculated by segmenting nuclei with an intensity threshold and averaging intensity inside and outside nuclear mask, respectively. Dotted line, line with a slope given by the ratio of nuclear Cdk1 levels to cytoplasmic Cdk1 levels, measured using embryos expressing Cdk1-YFP; solid line, best-fit curve. Error bars, 95% CI. (F) Log-log plot of Cdk1 speed versus S-phase Cdk1 activation rate. Solid line, best-fit curve; dotted line, Luther’s formula. Error bars, 95% CI. For all graphs, *, p<0.05; **, p<0.001; ***, p<0.0001; ns, not significant. See also Figure S2.

