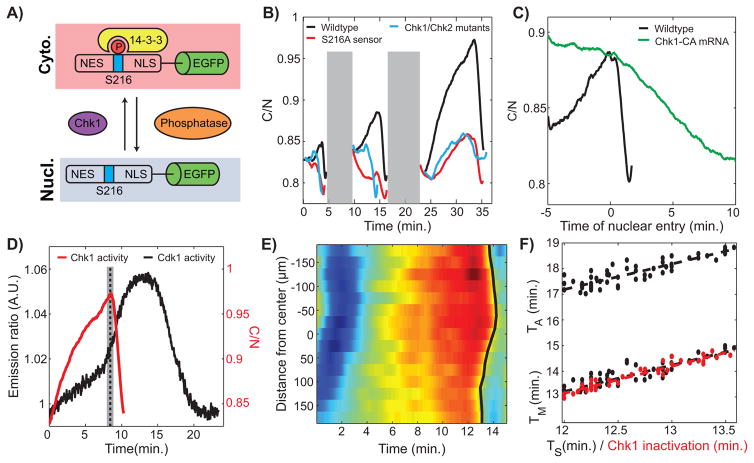
Figure 4. A Cdk1/Chk1 double negative feedback controls Cdk1 waves.
(A) Schematic view of Chk1 localization sensor. The cytoplasmic to nuclear ratio provides a readout of Chk1 activity. (B) Cytoplasmic to nuclear intensity ratio of the Chk1 sensor in wild type (black), mutant sensor (S216A; red line), and chk1 chk2 mutants (blue line) for cycles 11–13. In order to compare cell cycles of similar durations, we used cycle 15 (instead of cycle 13) for chk1 chk2 mutants. Gray shaded box represents mitosis, when the absence of nuclear envelope precludes a reliable measure of the C/N ratio. (C) C/N ratio for a cycle 12 wild type and an embryo injected with Chk1-CA mRNA. (D) Average Cdk1 and Chk1 activities at cycle 13 measured in two different embryos. Dotted line, completion of S-phase. (E) Heat-map of Chk1 activity over time and along the anterior-posterior (AP)-axis of an embryo. Black line, Chk1 inactivation wave front. (F) Time of entry into mitosis (TM) and anaphase start time (TA) as a function of the time of completion of S-phase (TS) (black line) and Chk1 inactivation (red line). Slopes: 1.0±0.1. See also Figure S3 and Movie S3.

