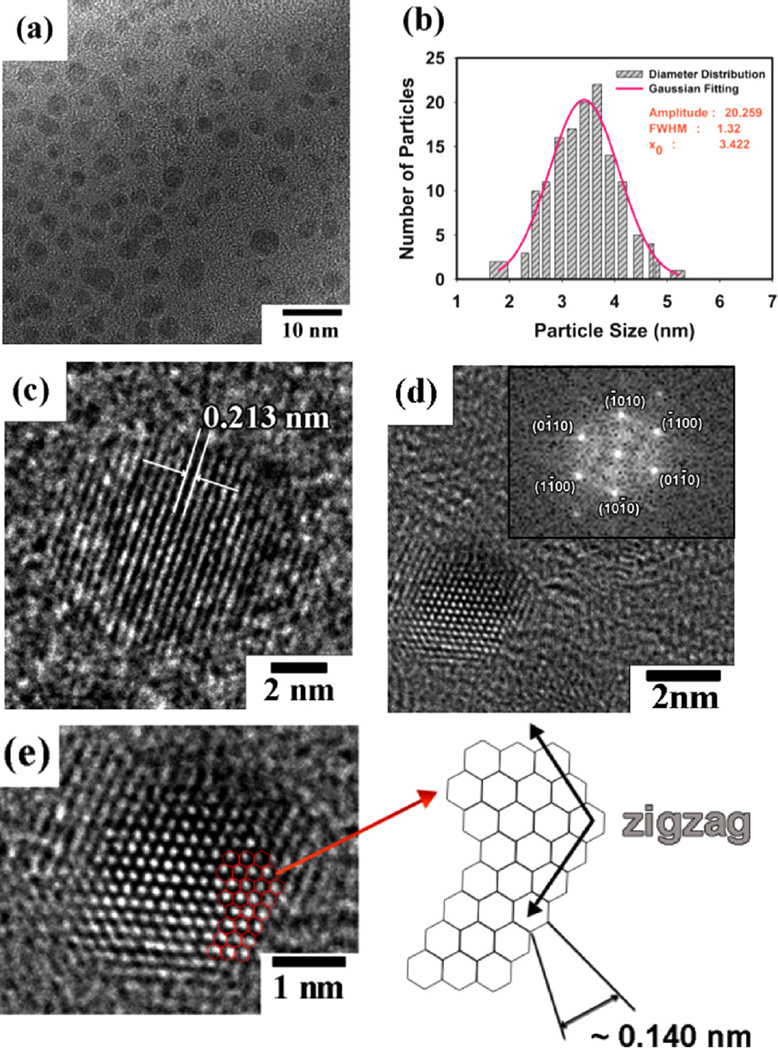
Fig. 3.
Characterization of the nanoparticles under HR-TEM showing: (a) the abundance and size range of the nanoparticles; (b) the statistical distribution of particle size peaking at 3.4 nm; (c) the measured lattice parameter of 0.213 nm corresponding to the (1100) in-plane lattice fringes of graphene; (d) the FFT analysis corresponding to the lattice fringes of graphene; and (e) the zigzag structure of the particles’ edges consistent with graphene.

