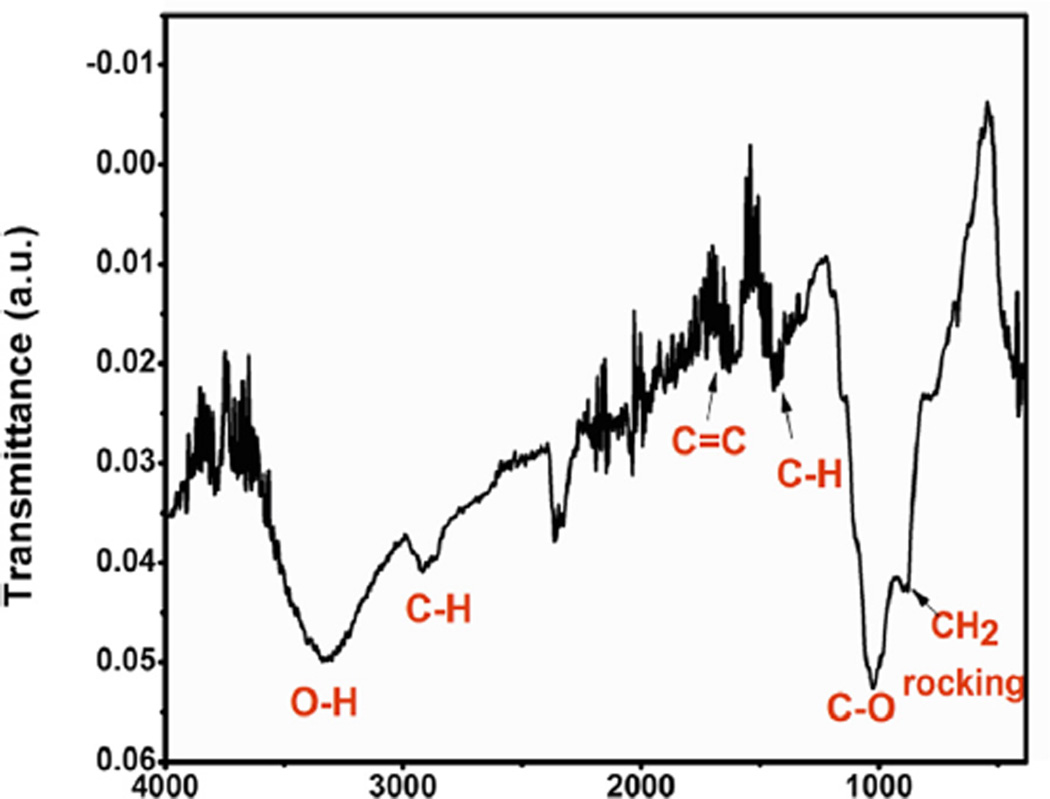
Fig. 7.
ATR FT-IR spectrum of GQDs on a silicon substrate. The absorption at 1620 cm −1 is attributed to C=C bonds in aromatic carbon, the one at 1423 cm −1 is assigned to −C−H bending, and the one at 2930 cm 1 is assigned C–H stretching. The spectrum also indicates the presence of C–O and hydroxyl groups on the surface of the GQDs.

