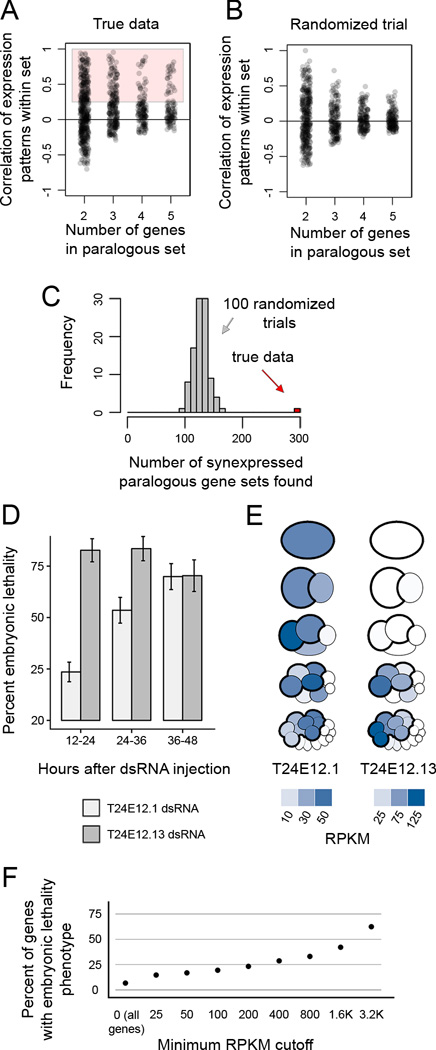
Figure 6. Previously unappreciated paralogous, synexpressed genes are critical for development.
(A) Correlations of expression patterns for sets of 2–5 genes that are similar to each other in sequence. 295 sets of genes had a correlation coefficient greater than 0.25, and were considered paralogous and synexpressed.
(B) Gene set correlations in a scrambled dataset.
(C) Histogram of the number of synexpressed paralogous gene sets detected in our dataset (red bar) and in 100 datasets randomized by scrambling gene names without replacement (gray bars).
(D) Lethality phenotype observed in embryos in which T24E12.1 and T24E12.13 were targeted by co-injection of dsRNA. Error bars represent 95% confidence interval. See Figure S4 for embryonic lethality in single injections and other pairs of genes co-injected.
(E) Pictograms showing quantitative transcript abundance data for the genes highlighted in (D,E).
(F) Percent of genes targeted by RNAi in Kamath et al. 2003 that show embryonic lethality. Genes are filtered by their transcript abundance as detected in present study.

