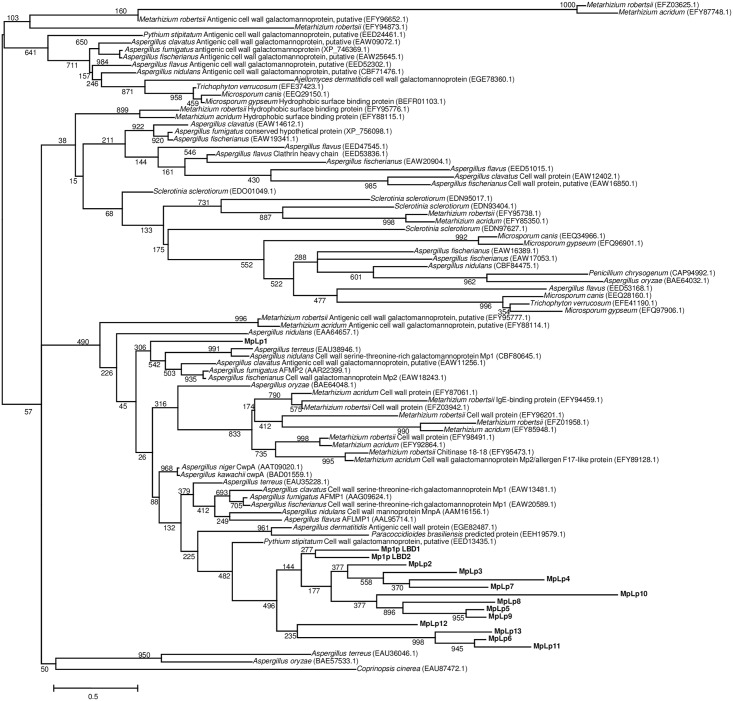
Fig 2. Phylogenetic analysis of the putative LBD of Mp1p homologs in T. marneffei and orthologs in other fungi.
Homologs of Mp1p in T. marneffei are shown in bold. The tree was constructed by maximum likelihood method with bootstrap values calculated from 1,000 trees and rooted on midpoint. The scale bar indicates the branch lengths that correspond to 0.5 substitutions per site as indicated. Names and accession numbers are given as cited in the GenBank database.

