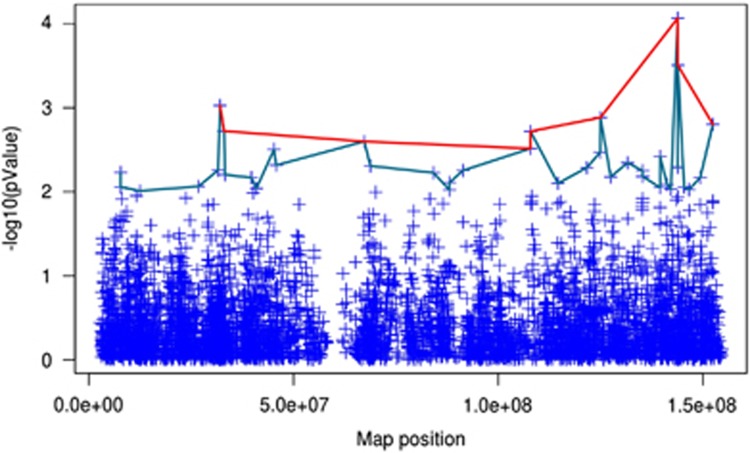
Figure 4.
Summary of the levels of significance for all SNPs on the X chromosome as two peaks are observed. The green line links SNPs that have −log10 (P-value)>2.5 (i.e., P<0.001), while the red line links SNPs with −log10 (P-value)>2 (i.e, P<3.1 × 10⁻³). Two regions of chromosome X associate with a higher level of significance to maternal history of hypertension: one is comprised between 10000000 and 52058362 bp; the other one ranges from 123825787 to 168825787 bp.

