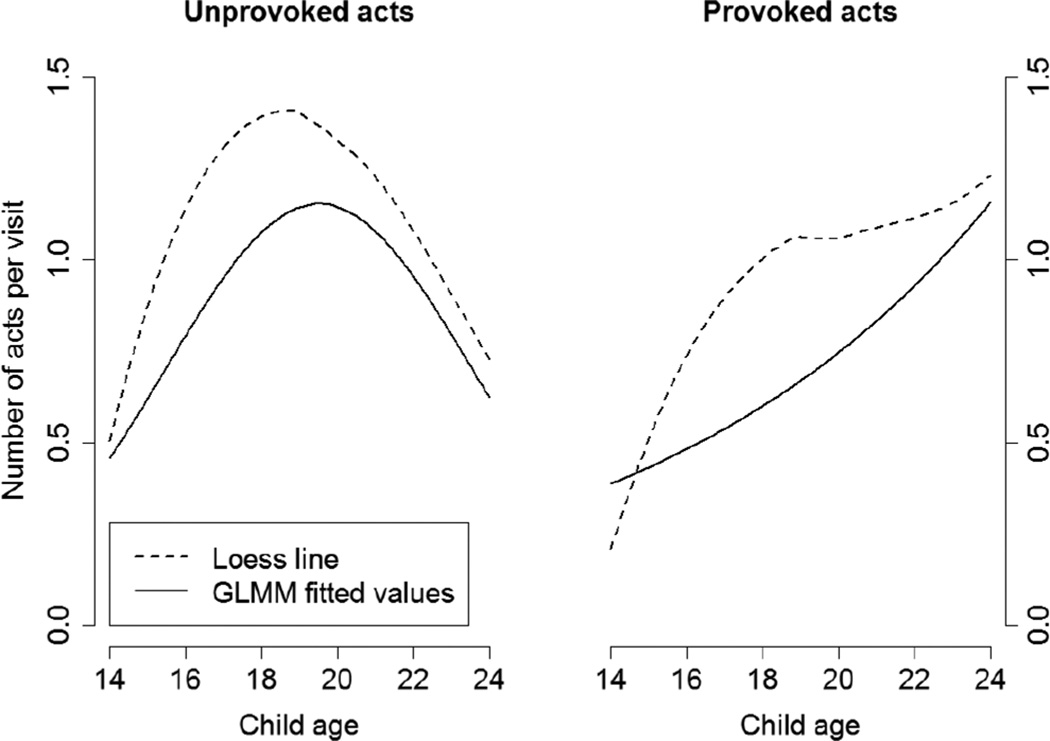
Figure 4.
Study 2: Relation between child age and frequency of unprovoked and provoked acts of force per visit. Dashed lines show predicted values from a local polynomial regression fitting (Loess, span = 1). Solid lines show fitted values from Poisson GLMMs with random intercept for child and fixed linear and (unprovoked only) curvilinear effects of age.

