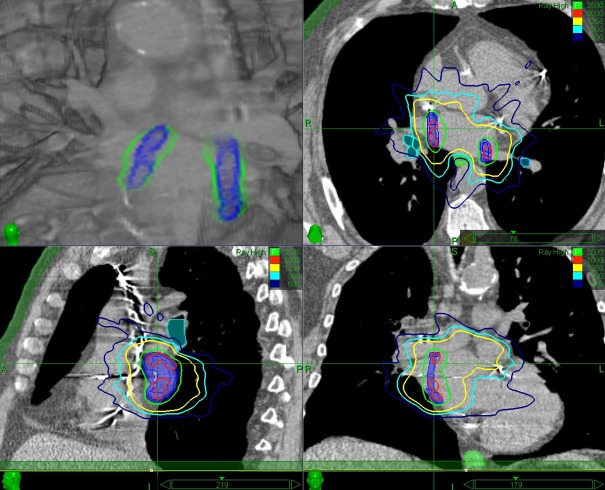
Figure 6. Example of an atrial fibrillation radiosurgery treatment plan in MultiPlan® (Accuray, USA).
3D dose overlay (top left), axial (top right), sagittal (bottom left) and coronal (bottom right) view Blue = planning target volume, green = esophagus, cyan = bronchial tree Isodose lines = 30 Gy (red), 25 Gy (green), 12.5 Gy (yellow), 9 Gy (cyan), 6 Gy (blue)

