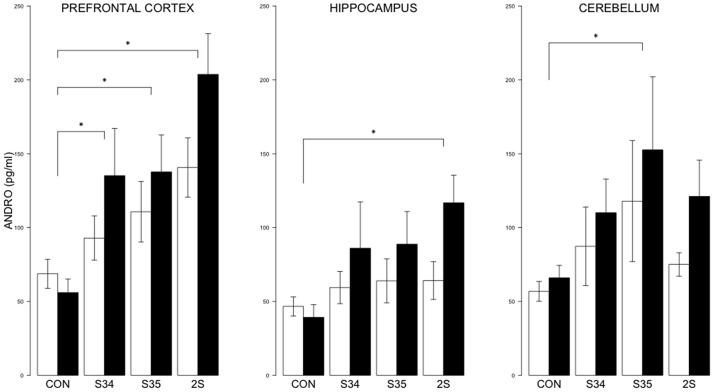
Figure 6.
ANDRO levels in the prefrontal cortex, hippocampus, and cerebellum as a function of stress in mTBI and SHAM rats. The legend is the same as Figure 3. In prefrontal cortex, ANDRO levels of the S34, S35, and 2S groups were higher than those of CON rats. In the hippocampus, ANDRO levels of 2S rats were greater than those of CON rats. In the cerebellum, ANDRO levels of s35 rats were greater than CON rats. ANDRO levels of mTBI rats were greater than SHAM rats in prefrontal cortex and hippocampus. Asterisks indicate ps < 0.05.

