Figure 9.

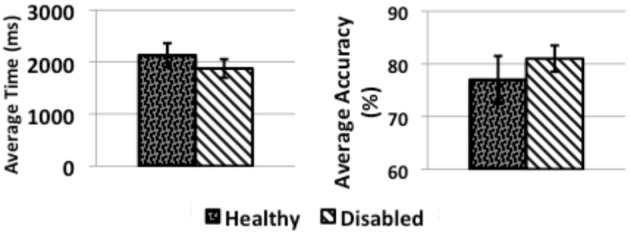
Bar charts summarizing the median task accuracy and time to activation across Experiments 1 and 2. The error bars are the 95% bootstrapping confidence intervals.

Bar charts summarizing the median task accuracy and time to activation across Experiments 1 and 2. The error bars are the 95% bootstrapping confidence intervals.