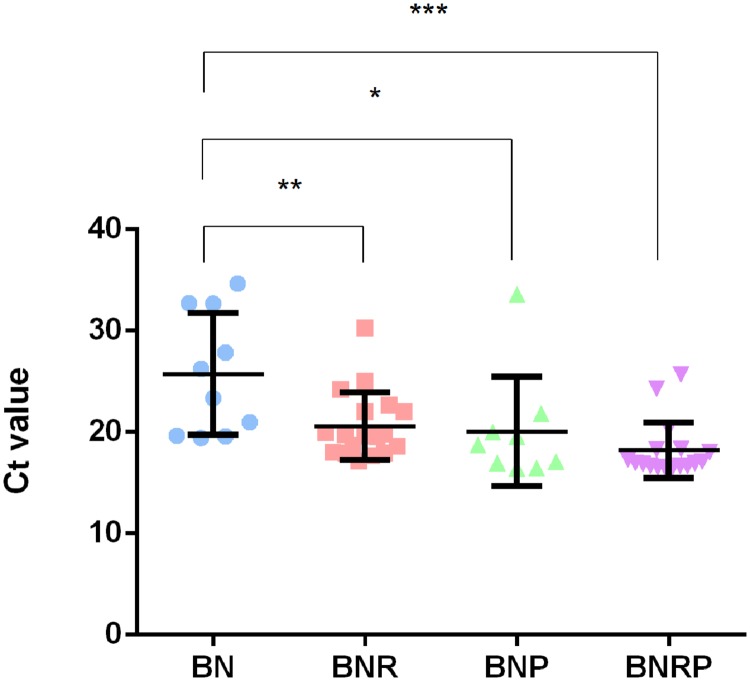
FIGURE 2.
Distribution of Ct values in four different enrichment conditions at 42°C. Bolton broth with Bolton supplement (BN), BN with rifampicin (BNR), BN with polymyxin B (BNP), and BN with rifampicin and polymyxin B (BNRP). Statistical analysis was conducted with one-way analysis of variance (ANOVA) using GraphPad Prism 6 (GraphPad Software Inc., USA). *P ≤ 0.05, **P ≤ 0.01, and ***P ≤ 0.001.

