
FIGURE 4.
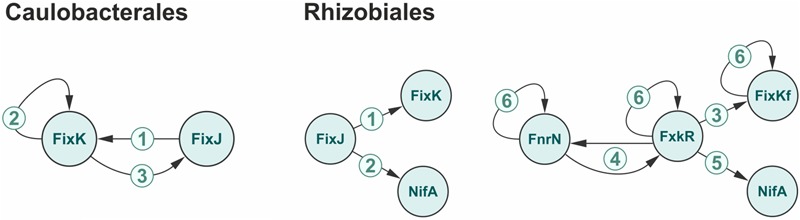
Gradual growth of complexity for the nitrogen regulatory network. The numbers represent the levels of the network complexity. For the details see the text.
Official websites use .gov
A
.gov website belongs to an official
government organization in the United States.
Secure .gov websites use HTTPS
A lock (
) or https:// means you've safely
connected to the .gov website. Share sensitive
information only on official, secure websites.
Gradual growth of complexity for the nitrogen regulatory network. The numbers represent the levels of the network complexity. For the details see the text.