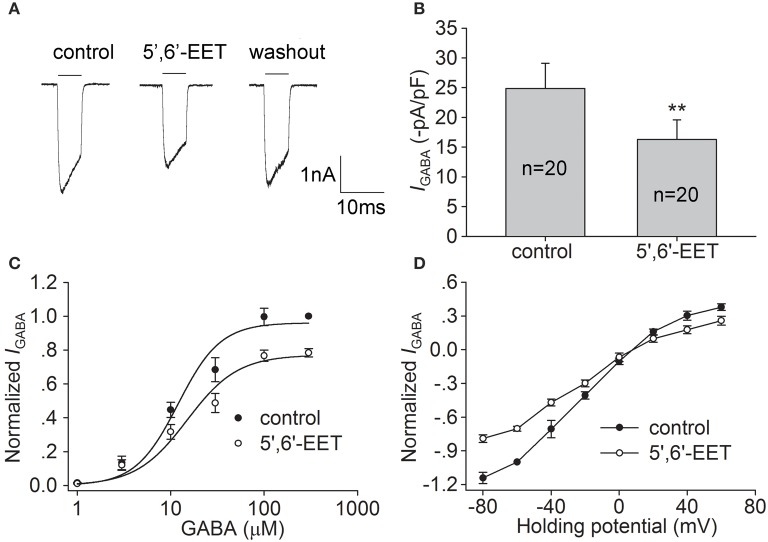
Figure 3.
Effect of 5,6-EET on IGABA in hippocampal CA1 pyramidal neurons. (A,B) IGABA (activated by 10 μM GABA) was inhibited by 300 nM 5,6-EET. The representative recordings show that IGABA was −3.0, −2.2, and −2.7 nA before, during and after 5,6-EET treatment, respectively (A). On the average, IGABA was reduced from −24.9±4.2 to −16.3±3.3 pA/pF. **P < 0.01 vs. control (B). (C) Dose-response curves for IGABA before and during 5,6-EET treatment. Each point represents the normalized current from 8 to 10 neurons. (D) I–V curves for IGABA in the absence and presence of 5,6-EET. Each point represents the normalized current from 8 to 10 neurons.

