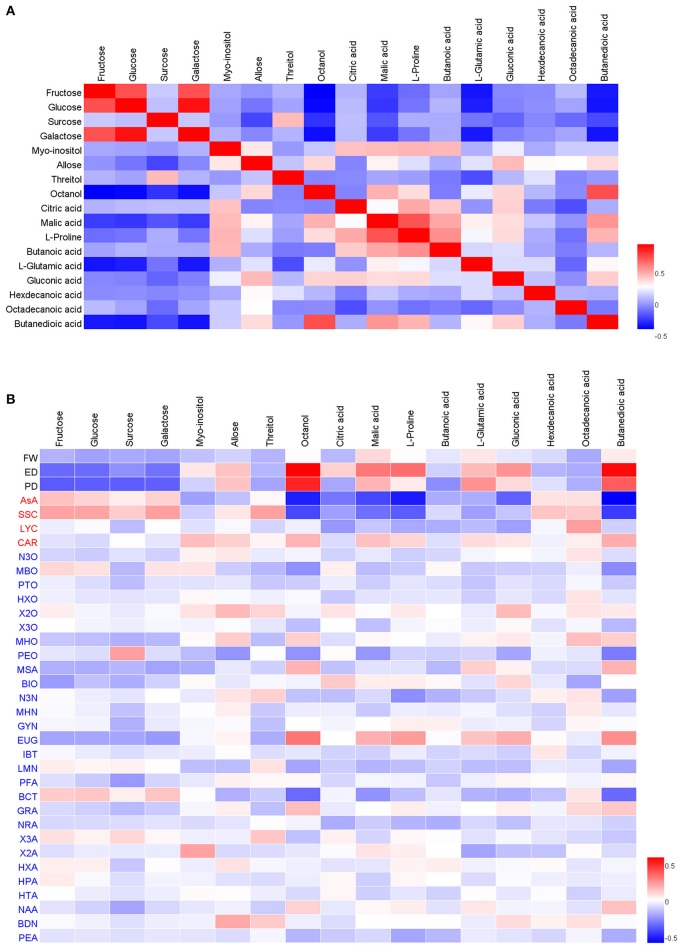
Figure 1.
The Pearson correlation analysis of the main sugars, organic acids, morphological, nutritional, and sensory traits. Panel (A) is the correlation between the main sugars and organics; Panel (B) is the correlation between the main sugars, organic acids, and morphological, nutritional and sensory traits. Positive correlations are indicated in red, while negative correlations are indicated in blue.

