
FIGURE 1.
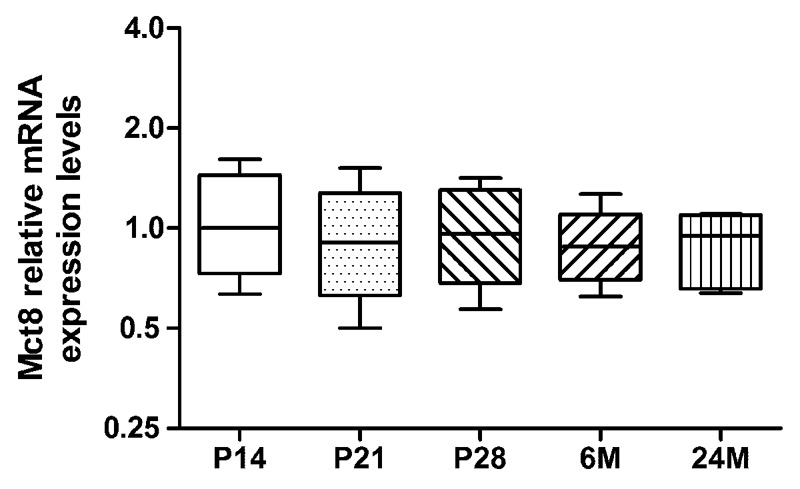
Expression levels of Mct8 mRNA: quantitative reverse transcriptase-mediated polymerase chain reaction (qRT-PCR) was performed with eyecup homogenates at varying age (P14, P21, P28, 6M, and 24M). Mct8 mRNA levels are given as fold-changes relative to P14 expression levels, arbitrarily set to 1. Note that normalization and statistical analysis were performed in the Ct scale (log2), as described in “Materials and Methods.” Data are presented as fold changes, median ±25%/75% quartile and maximum/minimum value (n = 6 per age group).