
FIGURE 2.
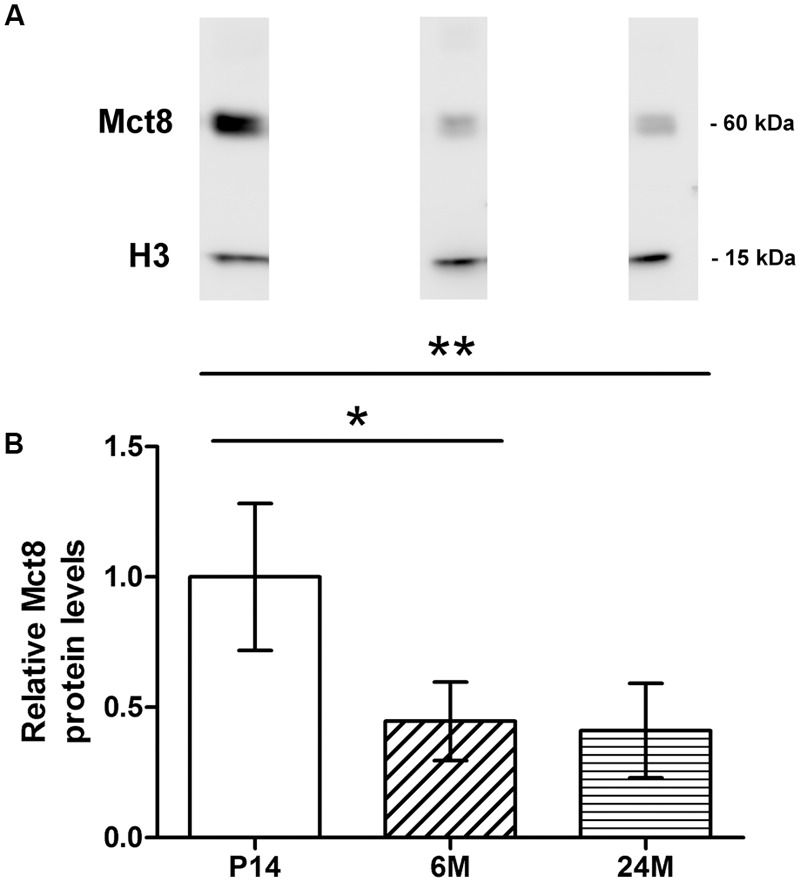
Western blot analysis of MCT8: Western blotting was performed with eyecup homogenates of P14, 6M, and 24M mice with an antibody against MCT8 (predicted: 60 kDa) and an antibody against H3 (predicted: 15 kDa) as internal loading control. Each blot (A) corresponds to the age groups shown in the barplot below. (B). Each band is representative for one age group and was taken from the same blot, respectively. Barplots are depicted relative to P14 MCT8 protein levels, arbitrarily set to 1. Specific bands for MCT8 and H3 were detected in the Western blots, with significant differences between P14 and 6M/24M. Data are presented as mean ± SD (n = 4 per age group). ∗∗p < 0.005; ∗p < 0.05.