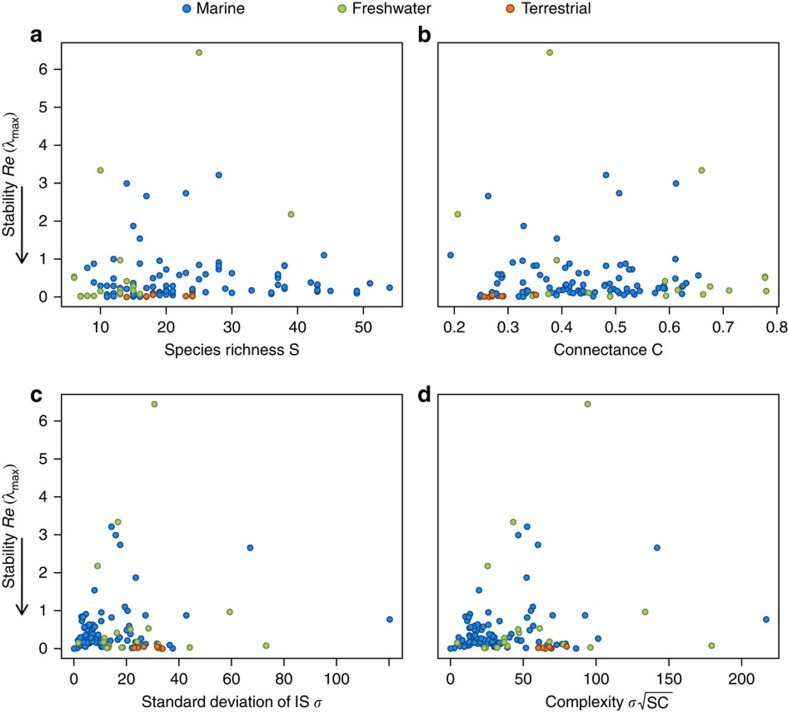
Figure 2. Food web stability related to complexity parameters in 116 food webs.
(a) Number of species S (linear regression: P=0.97, R2<10−5), (b) Connectance C=(L/S2) where L is the number of links (P=0.98, R2<10−6), (c) Standard deviation of interaction strengths σ (P=0.1, R2=0.02), (d) May's complexity measure  (P=0.02, R2=0.04). Stability is measured as Re(λmax) for marine (blue), freshwater (green) and terrestrial ecosystems (orange). Food webs with eigenvalues close to zero are the most stable. All quantities are dimensionless.

