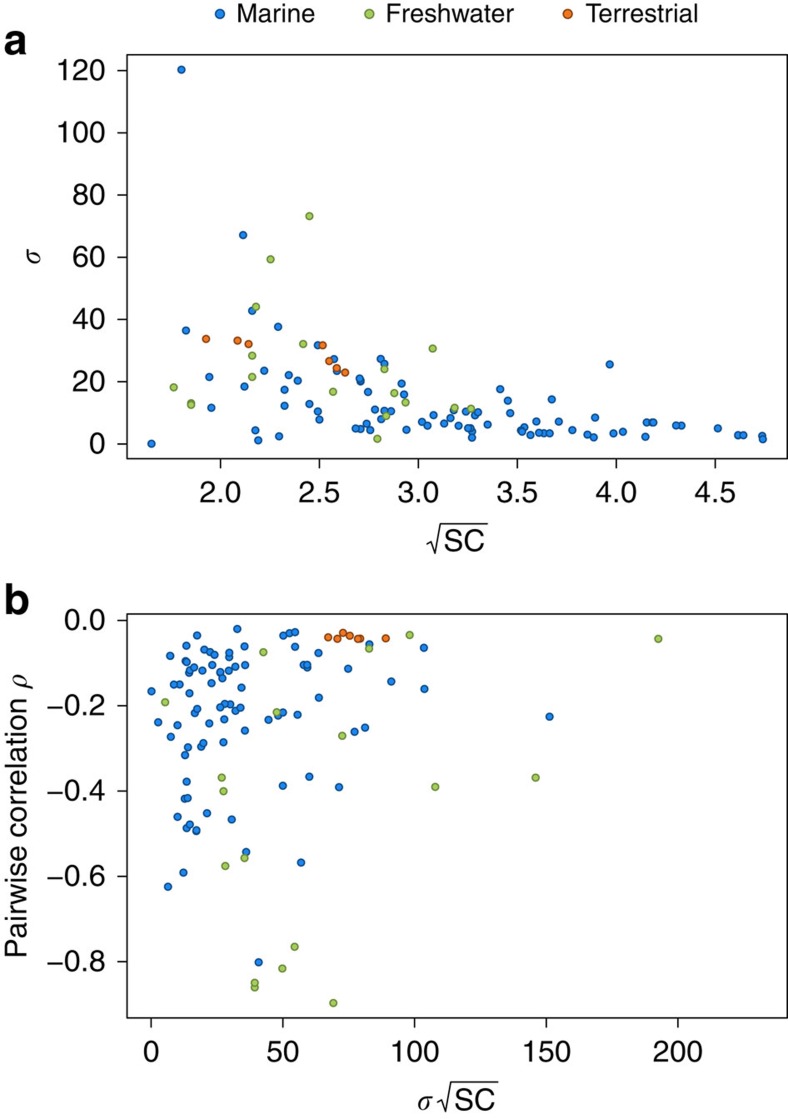
Figure 3. Correlation between complexity parameters in real food webs.
(a) σ is the s.d. of interaction strengths, S the number of species and C the connectance. The product  was negatively correlated to σ (Spearman's rank correlation (P<10−13, r=−0.64). (b)
  is the correlation between pairwise interactions. The product
  was positively correlated to ρ (P=0.02, r=0.22).

