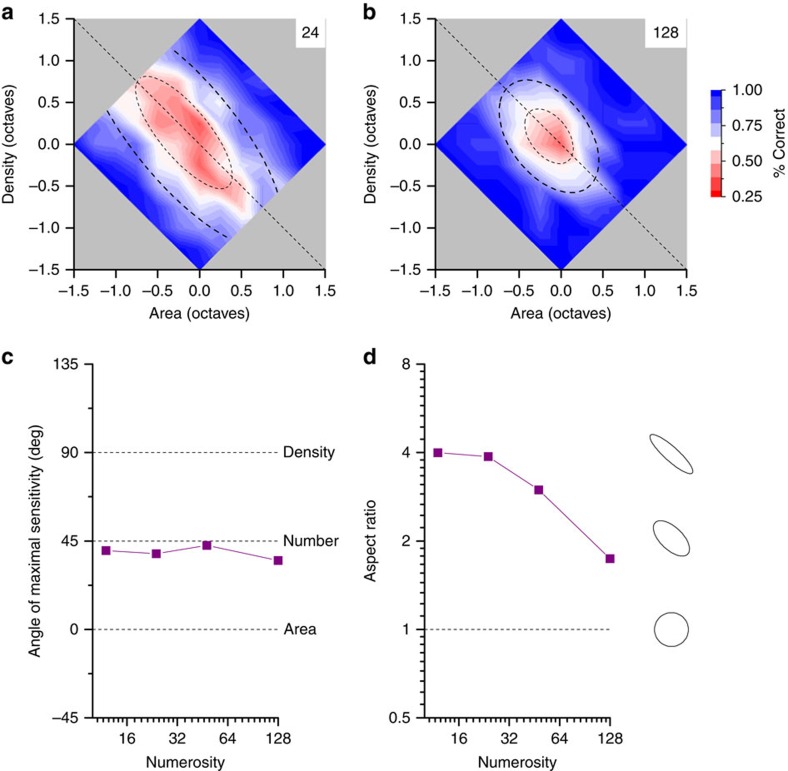
Figure 2. Discrimination boundaries in area–density space.
(a) 2D psychometric function for measuring thresholds in the area/density space with the ‘odd-one-out' task, for a standard of 24 dots. Per cent correct (pooled across two subjects) is plotted as a function of log area and log density (see heat map at right). The maps show interpolated responses. The raw data were fit with a 2D Gaussian varying between 100 and 33% (chance). The dashed lines show the 50 and 75% performance. (b) 2D psychometric function measured with a standard of 128 dots. Conventions as in A. (c) The orientation of the short radius (maximal sensitivity) of the best-fitting 2-D Gaussian, as a function of numerosity. The orientation tended to +45° at all numerosities, aligned with the number axis. (d) Ratio of s.d. of the long to short radii, as a function of numerosity. For low-to-moderate numerosities the oval was strongly elongated, by a factor of four. Even at the highest numerosity, the oval remained elongated orthogonal to the numerosity axis, with an aspect ratio of 1.7.

