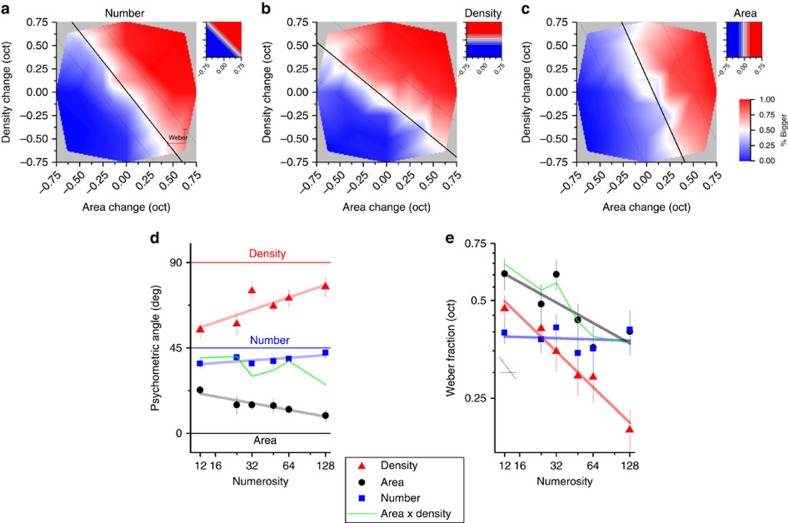
Figure 3. Explicit number area and density judgments in area–density space.
(a) 2D psychometric functions for explicit number comparisons (which patch appeared more numerous) for a standards 12 dots, plotting per cent ‘more' pooled across six subjects, as a function of log area and log density. The maps are obtained by linear interpolation (see heat map at right for values). The raw data are fitted with a 2D cumulative Gaussian error function, varying between 0 and 100%. The dashed lines show ±1 s.d.; Weber Fraction is the total change needed to attain 84% correct responses. The small insets at right show how an ideal observer would perform, responding correctly to the task. However, the data for all three tasks tended to oriented near the numerosity axis, suggesting that numerosity was used for all tasks. (b) Explicit density judgments: conventions as in a. (c) Explicit area judgments: conventions as in a. (d) The orientation of the choice axes (deviation from vertical), as a function of numerosity. For the numerosity task (blue symbols), the functions were oriented near +45° at all numerosities (orthogonal to the number axis), suggesting that numerosity provided the primary information for the task. The functions for density (red symbols) were also oriented near +45° at low numerosities, suggesting that density judgments also relied on numerosity. Area judgments (black symbols) were also strongly influenced by numerosity at low numerosities. The green curves show the predictions for numerosity judgments, if they were based on the product of density and area. (e) Weber fractions (log (change in area) + log(change in density) at threshold), as a function of numerosity. The lines are best-fitting linear regressions, with slopes of −0.36, −0.21 and −0.01 respectively for density (red triangle), area (black circle) and number. Weber fractions for number remained constant over the range (Weber's law), while density decreased with a slope near −0.5 (square root law). Area also decreased with numerosity. The green curves show the predictions for numerosity judgments, if they were based on the product of density and area. For high numerosities, the predictions are reasonable, but at low numerosities far too high.

