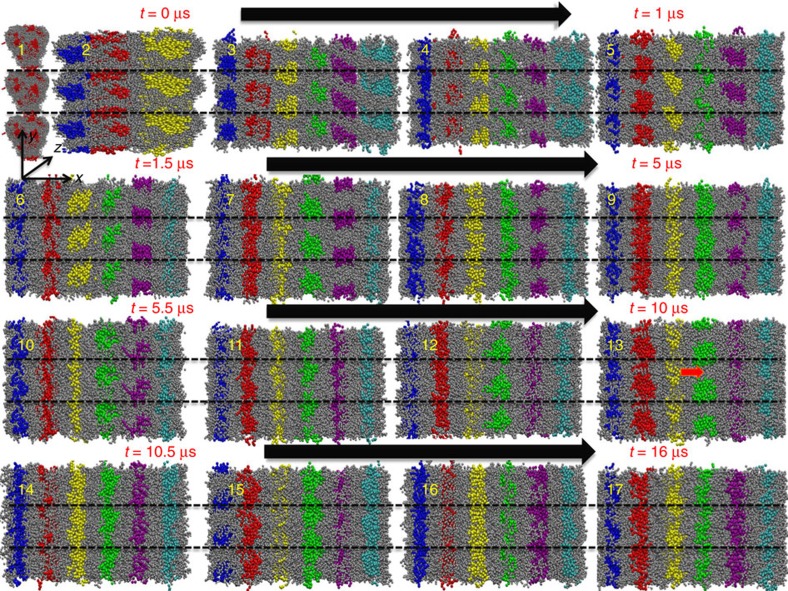
Figure 3. Dynamic process of fibre formation from a homogenous mixture.
Snapshots show dynamical evolution from ∼0.1 to 16 μs during stage 2 of the fibre assembly process. The axial view (along the axis) of the fibre is depicted. Snapshot 1 shows the micelle formation (simulation time ∼0.1 μs). Snapshots 2 and 3 suggest fibre formation (simulation time >∼0.1 and <∼0.4 μs). Snapshot 4 shows the breaking of longer fibre into smaller micelles (simulation time >∼0.4 and <∼0.5 μs). Snapshots 5 to 7 show formation of fibres adjacent to bulk water beads (simulation time >∼0.5 and <∼0.8 μs). Snapshots 8 to 11 show formation of subsequent fibres (simulation time >∼0.8 and <∼3.0 μs). Snapshot 12 to 15 suggest breaking and formation of fibres (simulation time >∼3.0 and <∼12.0 μs). Snapshots 16 and 17 show stable fibres (simulation time >∼12.0 till ∼16.0 μs). Hydrophobic tails of six micelles and fibres are shown in blue, red, yellow, green, purple, and cyan. The hydrophilic groups are shown in grey. Water beads are not shown for clarity. Black line shows the periodic boundaries. Fibres 1, 2, 3, 4, 5, and 6 are shown in blue, red, yellow, green, purple, and cyan hydrophobic tails, respectively. Black arrow shows the increase in simulation time. Red arrow shows the breaking of fibres.

