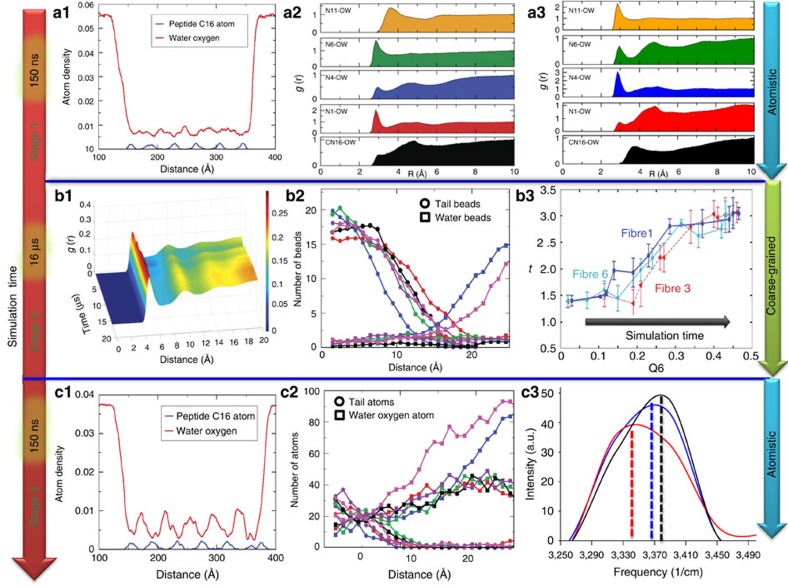
Figure 4. Role of local ordering and solvation effects in driving the self-assembly of PAs.
Radial distribution function (RDF) (g(r)) of oxygen of water with CN16, N1, N4, N6 and N11 atoms of the hydrophobic tail, Alanine, Histidine, Leucine and Lysine amino-acid residues of PAs, respectively (Supplementary Fig. 1), (a2) after ∼500 ps and (a3) after ∼150 ns in stage 1. (a1) X axis density of water and C16 atom type of PAs at the end of ∼150 ns for CHARMM force-field in stage 1. X=0 refer to the minimum X axis value or in other words the minimum X axis coordinates of the box length. (b1) RDF (g(r)) of water beads with Lysine beads of the PAs of fibre 1 during 16 μs of simulation run. RDF suggests increase in ordering of water molecules with increase in simulation time. See Fig. 2 for fibre index. (b2) Number distribution of hydrophobic tail and water beads for coarse-grained model during the last 2 μs of the simulation in stage 2. (b3) The order parameters Q6 and t of water beads within 15 Å of fibres 1, 3 and 6 shown in blue, red and cyan, respectively. Ordering of water beads increases for all fibres as simulation progresses from 0.5 to 10 μs. After 10 μs water ordering is not affected as fibres 1, 3 and 6 are stabilized. Note, similar increase in ordering of water was observed for fibres 2, 4 and 5 with increase in simulation time. (c1) X axis density of water and C16 atom type of PAs at the end of ∼150 ns for CHARMM force-field in stage 3. Density profile of water and PAs also confirms the presence of small quantity water molecules into the PAs at the end of stage 3. (c2) Number distribution of hydrophobic tail and water molecules during last 10 ns of the simulation in stage 3. (c3) The stretching band of the vibrational spectra for hydrogen of water molecules at the end of stage 1 and stage 3 and for bulk water. The black, blue, and red lines represent bulk water, proximal water at the end of stage 1, and proximal water at the end of stage 3, respectively.

