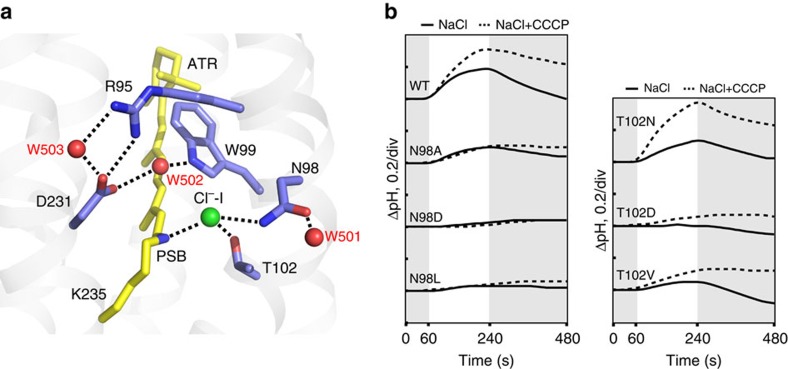
Figure 3. ClR structure at the PSB region.
(a) Detailed structure of ClR at PSB. Chloride ion and water molecules are shown by green and red spheres, respectively, and hydrogen bonds are depicted in dashed lines. (b) Light-induced pump activities of wild-type (WT) ClR and its mutants at Asn98 and Thr102. The pumping activities are measured in NaCl (lines) and NaCl with carbonyl cyanide m-chlorophenylhydrazone (CCCP; dashed lines). Grey and white sections indicate dark and light conditions, respectively.

