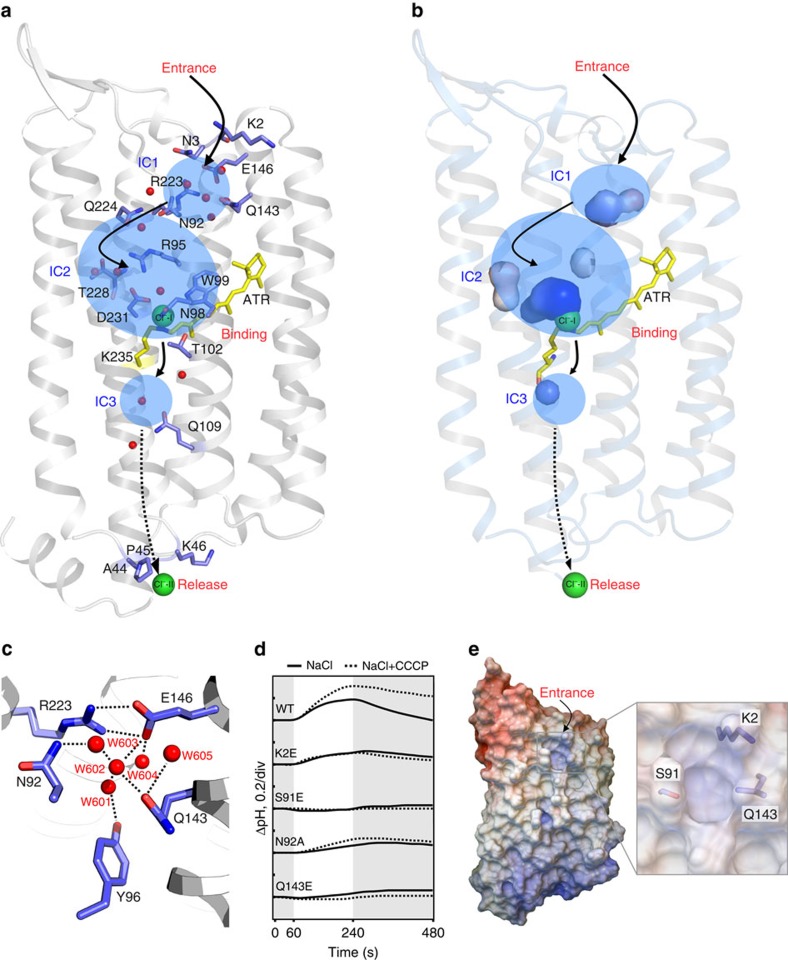
Figure 5. Chloride ion conductance pathway in ClR.
(a) Three internal cavities (IC1–IC3) inside the ClR structure are highlighted in transparent blue. Water molecules inside the ClR structure are shown in red spheres and amino-acid residues, which interact with the water molecules are indicated. Proposed chloride ion conductance pathway in ClR is shown in arrows (beyond water molecules, dashed arrow). The chloride ions bound to ClR and ATR are shown in green spheres and a yellow stick model. ClR is in the same orientation as Fig. 1a. (b) Cavity surface view of ICs in a. (c) Magnified view of IC1. (d) Light-induced pump activities of wild-type (WT) ClR and its mutants at Lys2, Ser91, Asn92 and Gln143. The pumping activities are measured in NaCl (lines) and NaCl with carbonyl cyanide m-chlorophenylhydrazone (CCCP; dashed lines). Grey and white sections indicate dark and light conditions, respectively. (e) Surface electrostatic potential of ClR. A putative chloride ion entry hole is magnified.

