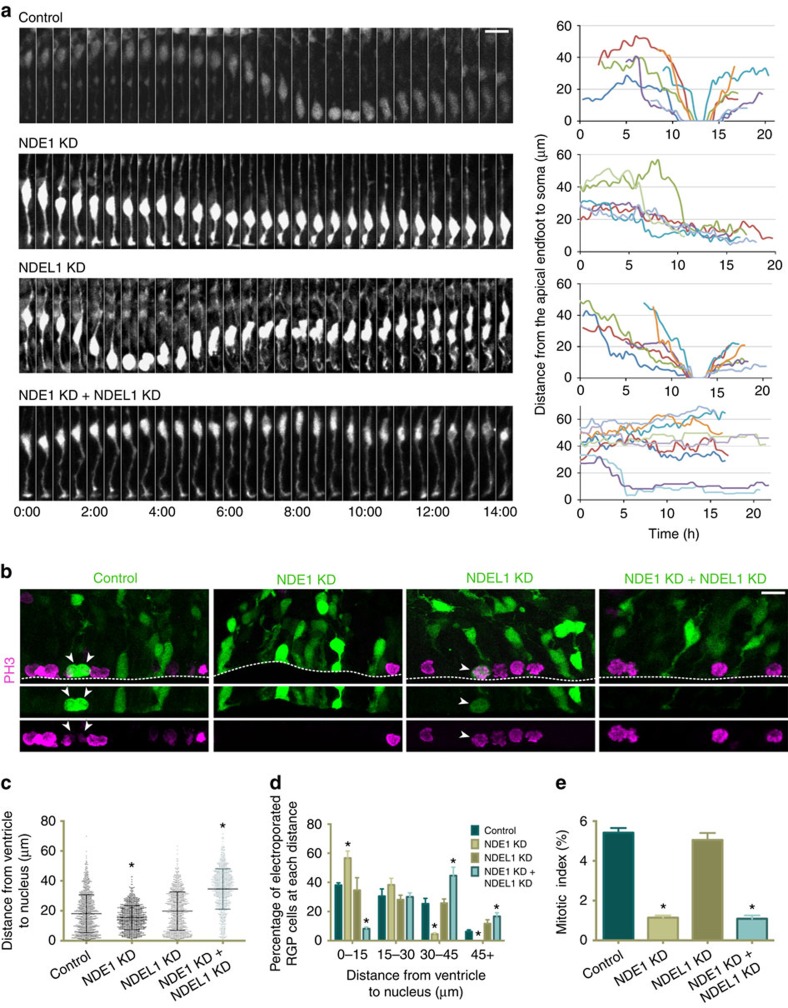
Figure 2. NDE1 knockdown blocks apical nuclear migration and potently reduces the mitotic index.
(a) Live-imaging montage of GFP-expressing RGP cells at E19 with a control empty vector expressing GFP alone, or shRNAs to NDE1, NDEL1 or both genes along with a GFP reporter. Representative tracings from multiple RGP cells for each condition are shown at right. Montage panels are shown at 30 min intervals (Supplementary Movies 1–4). (b) Representative images of the VZ from the electroporated brains stained for the mitotic marker phosphohistone-H3 (PH3). Arrowheads mark soma of PH3+/GFP+ RGP cells. Dashed line represents the ventricular surface. (c,d) Measurements of the distance between the bottom of the nucleus and the ventricular surface, corresponding to the apical process length, across the various conditions. NDE1 knockdown shifted the apical process length distribution towards shorter distances, with a significant accumulation of RGPs with an apical process of 0–15 μm. NDE1/NDEL1 double knockdown, however, shifted the apical process length distribution to larger distances, with a significant accumulation of RGPs with an apical process of 30–45 μm. Each dot represents an individual apical process length measurement for one electroporated RGP cell. (e) Effect of RNAi on RGP cell mitotic index, measured as the number of electroporated RGP cells positive for PH3 divided by the total number of electroporated RGP cells. All mitotic figures of RGP cells were located at the ventricular surface, and NDE1 knockdown, as well as NDE1/NDEL1 double knockdown, caused a strong reduction in the mitotic index. Data presented as scatterplot in c with bars representing the median±the interquartile range, and as mean±s.e.m. in d and e. Kolmogorov–Smirnov test for non-parametric distributions used in c (*P<0.05, n=1,012–1,073 RGP cells). Unpaired t-test used in d and e (*P<0.05, n=3 embryonic brains from different mothers). Scale bar, 10 μm.

