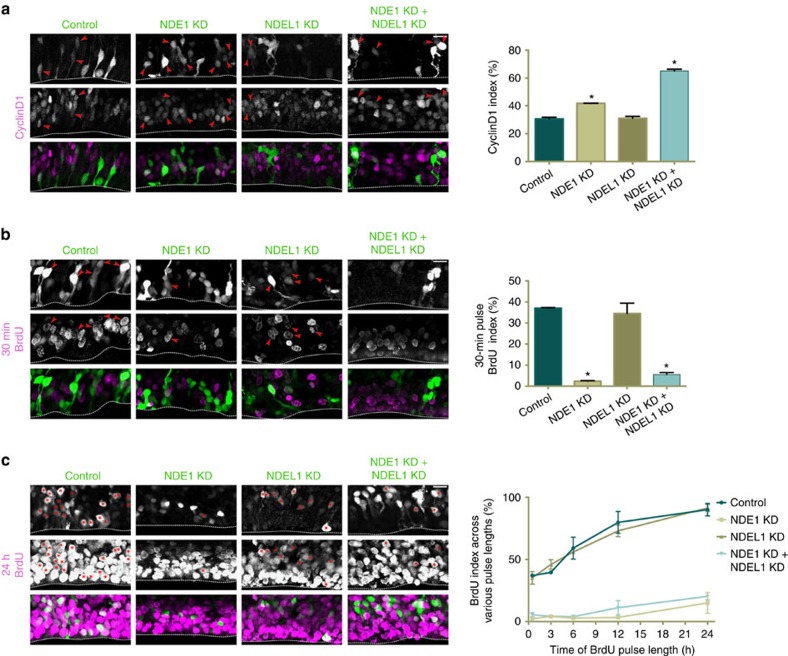
Figure 3. Double knockdown of NDE1/NDEL1 arrests cells at the G1-to-S transition.
E16 rat embryonic brains were electroporated with shRNAs for the various conditions and examined at E19. CyclinD1 staining was used to mark G1 cells, a 30 min pulse of BrdU used to mark S-phase cells, and BrdU pulses of varying length were used to distinguish RGPs that are arrested during the cell cycle from those actively cycling. The CyclinD1 and BrdU indices used in quantification were calculated as the amount of electroporated radial glia progenitors (RGPs) positive for either marker divided by the total number of electroporated RGP cells. (a) NDE1 knockdown caused a small but significant increase in CyclinD1-positive RGP cells, and the NDE1/NDEL1 double knockdown caused an even more substantial doubling of CyclinD1-positive RGP cells. There was no apparent difference between NDEL1 knockdown and control conditions. CylinD1-positive RGP cells tended to have soma located further away from the ventricular surface. Arrowheads mark electroporated RGP nuclei positive for CyclinD1. (b) NDE1 and NDE1/NDEL1 double knockdown caused a reciprocal and severe decrease in BrdU-labelled RGP cells. Again there was no significant difference between NDEL1 knockdown and control conditions. Arrowheads mark electroporated RGP nuclei positive for BrdU. (c) BrdU pulses of varying length revealed an increase in BrdU incorporation among control RGPs and NDEL1 knockdown RGPs, in contrast to the very minimal increase in BrdU incorporation over 24 h in the NDE1 and NDE1/NDEL1 knockdown conditions. Unpaired t-tests comparing knockdown conditions at each hour revealed no significant difference between control and NDEL1 knockdown, or NDE1 and NDE1/NDEL1 knockdown, while those two pairings were significantly different at every time point observed. Asterisks mark electroporated RGP cells positive for BrdU. Data are presented as mean±s.e.m. Unpaired t-tests used to compare conditions, *P<0.05, n=3 embryonic brains from different mothers. Scale bar, 10 μm in a–c. See Supplementary Figs 2 and 3 for further information regarding proliferation status cell cycle of knockdown RGP cells. Dashed line indicates ventricle surface.

