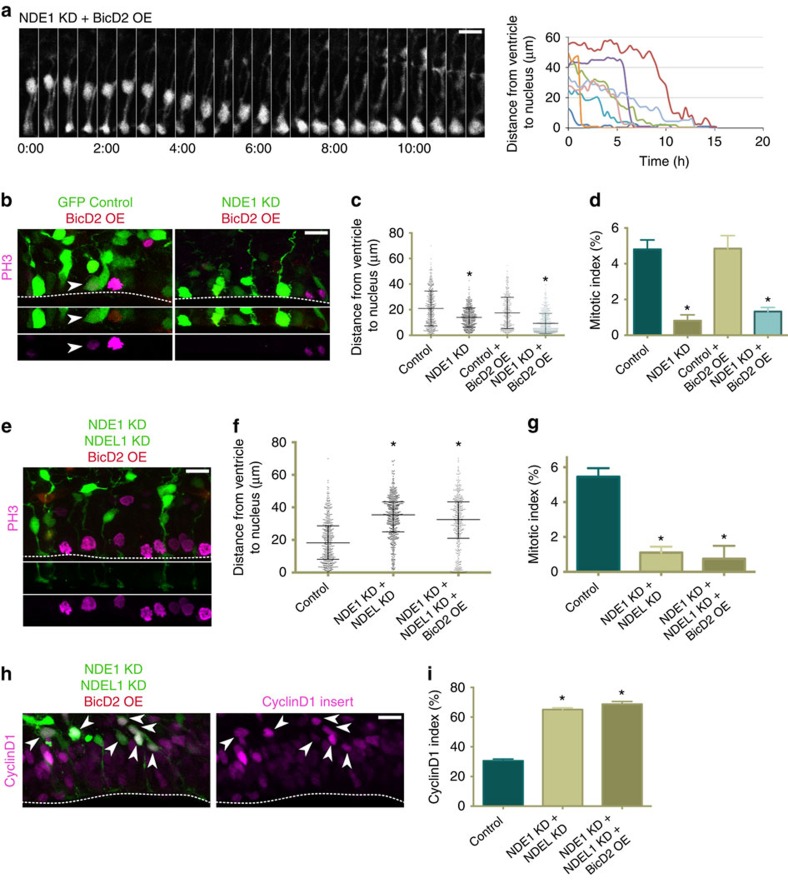
Figure 8. BicD2 overexpression rescues apical nuclear migration but not entry into mitosis in radial glia progenitors depleted of NDE1.
cDNA for full-length BicD2 was co-electroporated into embryonic rat brains with a GFP control empty vector or along with NDE1 shRNA or NDE1 and NDEL1 shRNAs at E16, and analysed at E20. (a) The overexpression of BicD2 in radial glia progenitors (RGPs) lacking NDE1 restores apical migration, though the soma accumulate at the ventricle for hours without any evidence of mitosis. Montage panels are shown at 30 min intervals. Full movie can be found in Supplementary Movie 8. (b) Representative images of BicD2 overexpression on both a wild-type and NDE1 knockdown background with staining for PH3. Arrowheads mark mitoses in electroporated cells. Dashed line indicates ventricular surface. (c) BicD2 overexpression did not alter the somal distribution of control RGP cells but caused the vast majority of NDE1 knockdown RGP soma to accumulate at the ventricular surface. (d) Despite the accumulation of RGP soma at the ventricle in NDE1 knockdown with BicD2 overexpression, the mitotic index remained reduced. (e) Representative image of RGP cells with BicD2 overexpression along with double NDE1/NDEL1 knockdown, stained for PH3. Dashed line indicates ventricle. (f,g) Overexpression of BicD2 with NDE1/NDEL1 double knockdown fails to rescue the somal distribution pattern or mitotic index of double NDE1/NDEL1 knockdown RGP cells. (h,i) The same ratio of RGP nuclei were positive for CyclinD1 whether or not BicD2 was overexpressed along with the double NDE1/NDEL1 knockdown, indicating the prominence of the G1-to-S block in the double knockdown, and the G2 specificity of the BicD2 rescue strategy. Arrowheads mark electroporated RGP nuclei positive for CyclinD1. Dashed line indicates ventricle surface. Data are presented as scatterplot in c and f with bars representing the median±the interquartile range, and as mean±s.e.m. in d,g and i. Kolmogorov–Smirnov test for non-parametric distributions used in c and f (*P<0.05, n=407–591 RGP cells in c and n=421–487 RGP cells in f). Unpaired t-test used in d,g and i (*P<0.05, n=3 embryonic brains from different mothers). Scale bars, 10 μm. Also see Supplementary Fig. 7.

