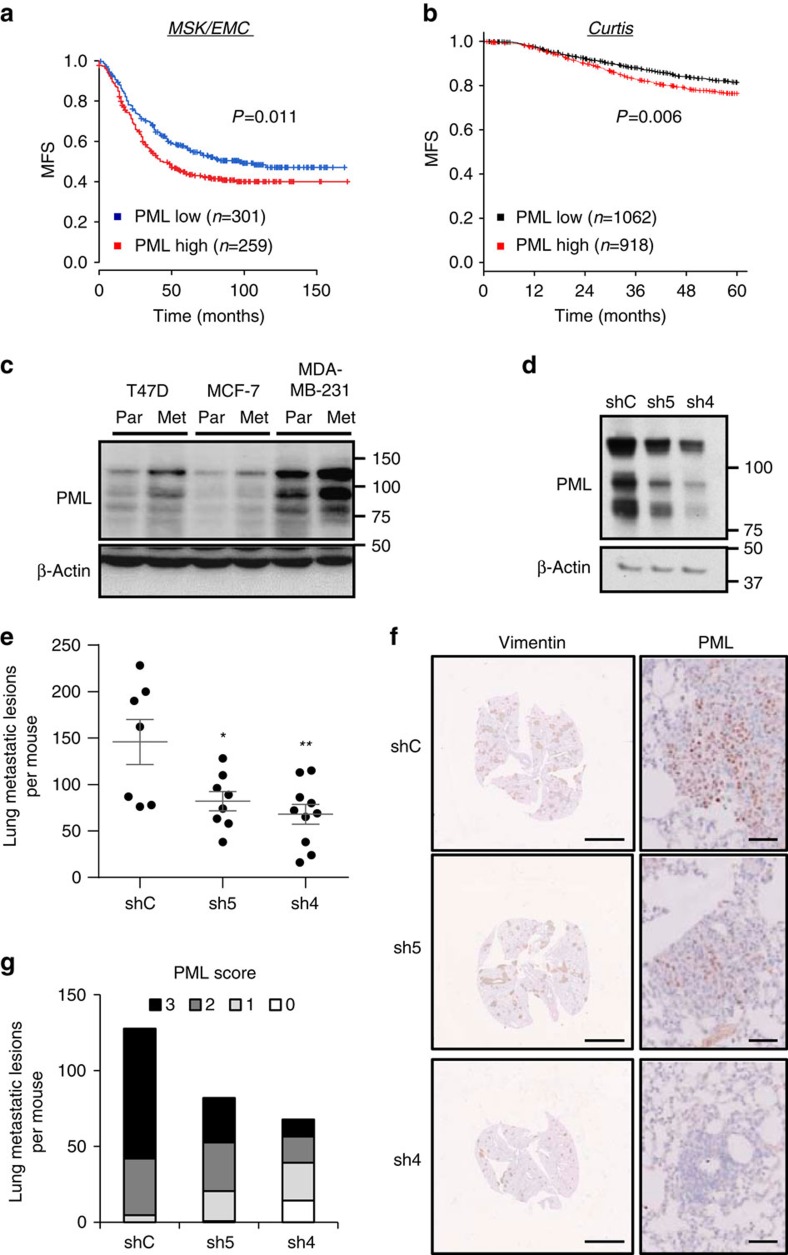
Figure 2. PML is associated to breast cancer metastatic dissemination.
(a,b) Kaplan–Meier representations of MFS based on PML RNA expression. (a) MSK/EMC data set, n=560. (b) Curtis data set (MFS before 60 months), n=1980. PML high: above the mean expression; PML low: below the mean expression. (c) Representative western blot out of three independent experiments, showing PML protein expression in cell line sub-clones selected for high metastatic potential (Par=parental and Met=metastatic). (d–g) Effect of PML silencing on metastatic capacity of intravenously injected metastatic MDA-MB-231 sub-clones (n=10 mice per condition): Western blot showing PML silencing in cells at the time of injection (d), number of metastatic lesions (e), representative immunostaining of Vimentin (scale bar, 3 mm) and PML (scale bar, 50μm) as indicator of metastatic lesions (f), and number of metastatic lesions for each PML immunoreactivity score (22 metastatic foci were scored and extrapolated to the number of total metastatic foci in each lung) (g). Error bars represent s.e.m., P value (*P<0.05; **P<0.01 compared with shC). Statistical test: Gehan–Breslow–Wilcoxon test (a,b) and one-tail unpaired t-test (e). MFS, metastasis-free survival; shC: Scramble shRNA; sh4 and sh5, shRNA against PML.

