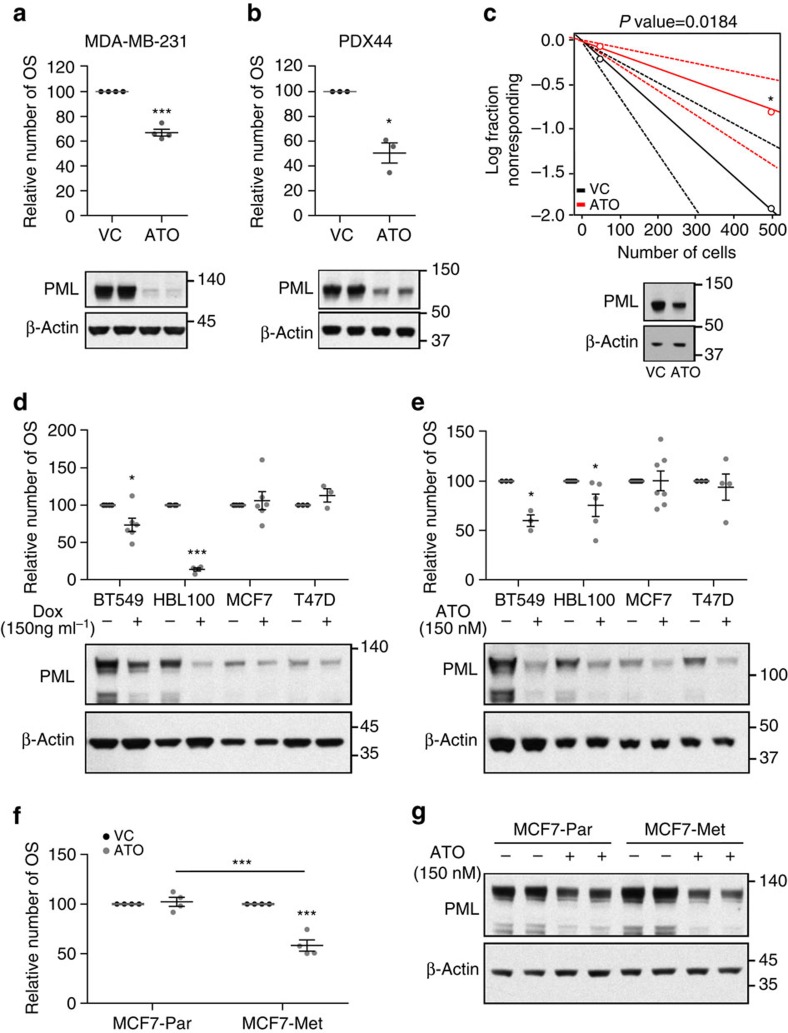
Figure 4. PML inhibition selectively targets PML-high-expressing breast cancer cells.
(a,b) Effect of 150 nM ATO treatment on OSI formation (top panels) in MDA-MB-231 (n=4) (a) and PDX44 cells (n=3) (b) and PML protein expression (3-day treatment, lower panels, representative western blot out of four—MDA-MB-231—or three—PDX44—independent experiments). (c) Limiting dilution experiment after xenotransplantation. Nude mice were inoculated with 500,000 or 50,000 MDA-MB-231 cells (n=20 injections per experimental condition). ATO cells were pre-treated with 150 nM ATO 2 days before injection. Tumour-initiating cell number was calculated using the ELDA platform. A log-fraction plot of the limiting dilution model fitted to the data is presented. The slope of the line is the log-active cell fraction (solid lines: mean; dotted lines: 95% confidence interval; circles: values obtained in each cell dilution). A PML western blot from cells at the time of injection is presented in lower panel. (d,e) OSI formation in cell lines with high (BT549 and HBL100) and low (MCF7 and T47D) PML expression upon PML genetic silencing (MCF7 and T47D n=3, and BT549 and HBL100 n=6) (d) and 150 nM ATO (BT549 n=3, HBL100 n=5, MCF7 n=7 and T47D n=4) (e). A representative PML western blot out of three independent experiments is presented in lower panels. (f,g) Effect of 150 nM ATO on OSI formation (n=4) (f) and on PML levels (a representative western blot is presented out of four independent experiments) (g) in MCF7 parental cells and MCF7 metastatic sub-clone. Error bars represent s.e.m., P value (*P<0.05; ***P<0.001 compared with each control). Statistics test: one-tail unpaired t-test (a,b,d,e,f), χ2-test (c). ATO, arsenic trioxide; Met, metastatic; OSI, primary oncospheres; Par, parental; VC, vehicle control.

