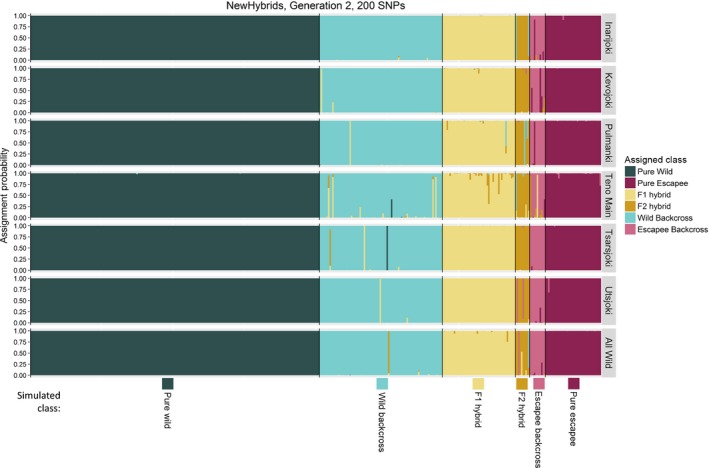
Figure 3.

Results of NewHybrids analysis for 400 individuals produced by two generations of simulated hybridization between aquaculture escapees (10% of the population) and wild fish from different Teno subpopulations. Each individual is represented by a vertical bar. Individuals are arranged along the x‐axis by simulated hybrid class, with different hybrid classes bounded by black lines. Y‐axis indicates the probability, returned by New Hybrids, that an individual belongs to one of the six possible hybrid classes (‘Assignment probability’). The different possible hybrid classes are indicated by different colours. For ‘All Wild’, the wild population was simulated using the average allele frequencies over all seven subpopulations
