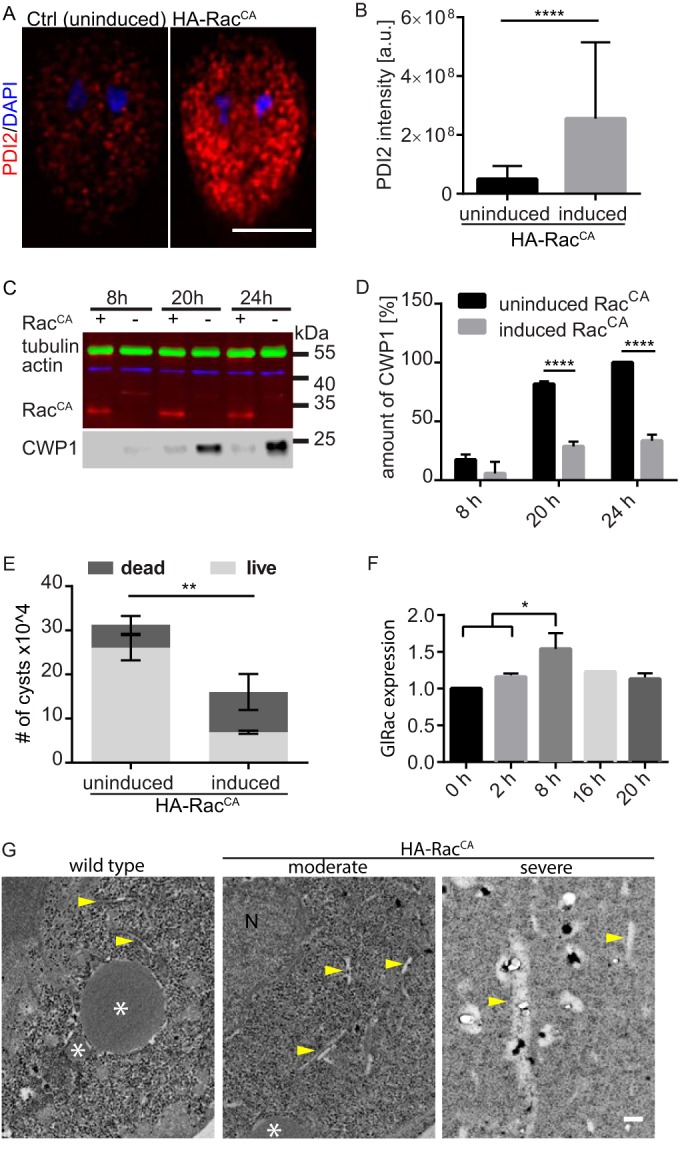
FIG 2 .

Constitutive GlRac signaling impairs ER function, CWP1 production, and cyst viability. (A) Expression of constitutively active GlRac resulted in increased PDI2 levels (red); representative images were acquired and scaled equally. Note that PDI2 levels in the control are similar to that of endogenously tagged Rac (see Fig. 1A); it was necessary to scale the image differently so that the induced HA-RacCA image would not be saturated. (B) Quantification of PDI2 levels. Statistical significance was evaluated from three independent experiments by t test (n = 45) for each condition: ****, P ≤ 0.0001. a.u., arbitrary units. Bar, 5 µm. (C) Western blot analysis showed decreased production of CWP1 in doxycycline-induced HA-RacCA encysting cells at 8, 20, and 24 h p.i.e. compared to production in the uninduced control. CWP1 was probed on the same blot after stripping. (D) Quantification of CWP1 levels from three independent experiments. Control cells at 24 h p.i.e. were set to 100%, and the relative amount of CWP1 was calculated based on normalization to the tubulin loading control. Statistical significance was evaluated by using the t test. ****, P < 0.0001. (E) Cyst production was quantified for induced HA-RacCA and control cells. Additionally, the cells were stained with the vital dye trypan blue to assay cyst wall integrity. Cysts production and viability data were acquired from three independent experiments, each with ≥200 cysts. Statistical significance was evaluated by using the t test. **, P < 0.01. (F) Relative expression of GlRac at 0, 2, 8, 16, and 20 h p.i.e. was tested by quantitative RT-PCR, for which GAPDH was used as a control. Three independent replicates, each consisting of three technical replicates, were evaluated by using the t test. *, P < 0.05. (G) TEM imaging of wild-type and doxycycline-induced HA-RacCA cells 13 h p.i.e. Yellow arrows, putative ER; N, nucleus; *, putative ESV. Bar, 200 nm.
