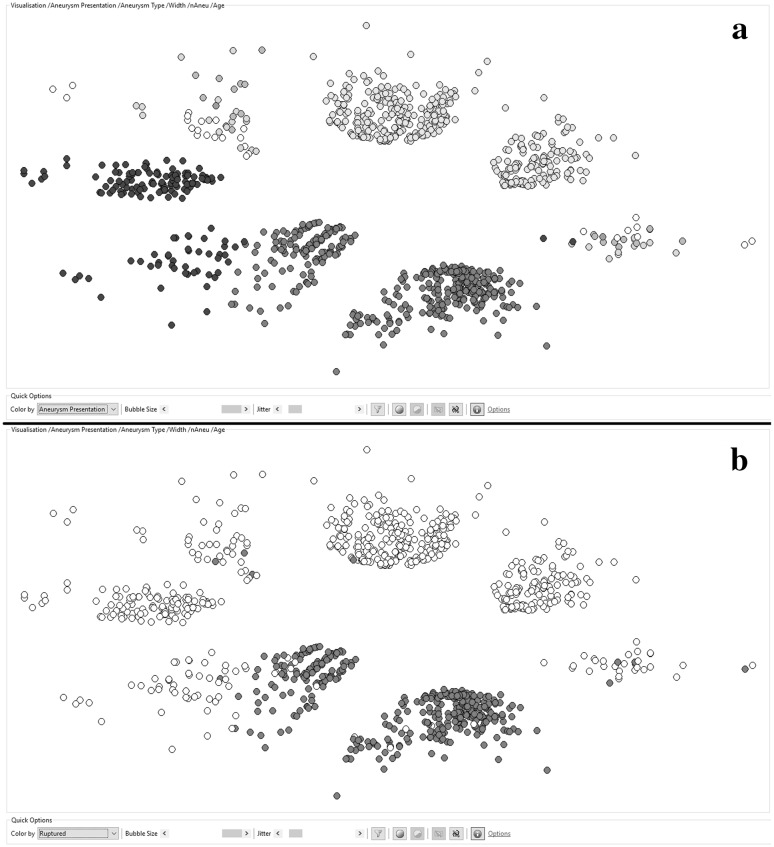
Fig. 2.
An ontology-guided nonlinear mapping of 1032 cerebral aneurysms with a distance calculation based on the following features: Aneurysm.Presentation, Aneurysm.Width, Aneurysm.Location, Patient.Number of Aneurysms, and Patient.Age. a The aneurysms are colored according to their presentation: green is incidental, blue is coincidental, and red is after a subarachnoid bleeding. b The aneurysms are colored according to their rupture state red are ruptured, white are non-ruptured. (Color figure online)

