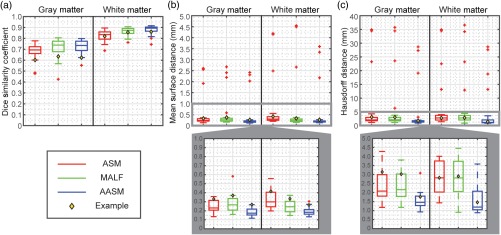
Fig. 5.
Quantitative comparison of ASM, MALF, and AASM segmentation of SC in terms of DSC, MSD, and HD. Note that additional zoomed-in boxplots are generated for MSD and HD to compare the results in a limited range. The yellow diamond marks indicate the subject demonstrated in Fig. 4.

