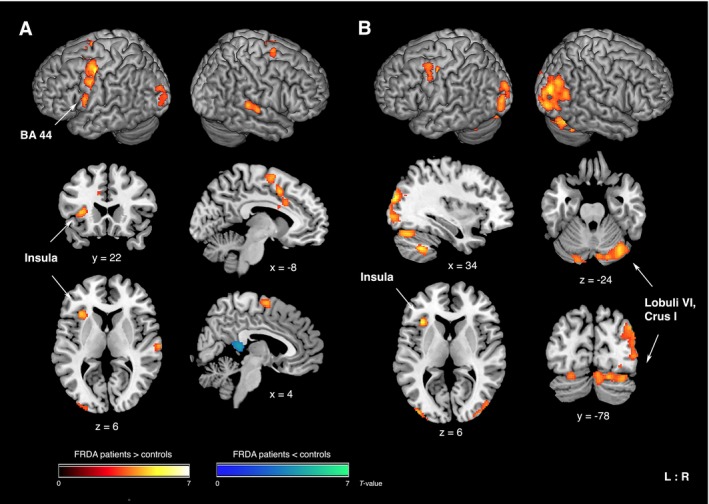
Figure 1.

Significant differences in BOLD‐response between FRDA patients and controls during phonemic verbal fluency (A) versus baseline and (B) versus overt speech. Higher functional activity in patients compared to controls is displayed in red‐yellow, lower activity in blue‐green (for visualization purposes only: significant ROI [BA44, insula, cerebellar lobules] are displayed at an uncorrected voxel‐level threshold of P < 0.001 within ROI; results outside of ROI are cluster‐level FWE corrected at P ≤ 0.05 across the whole brain). L/R: left/right; coordinates in MNI space; color bars represent T‐values.
