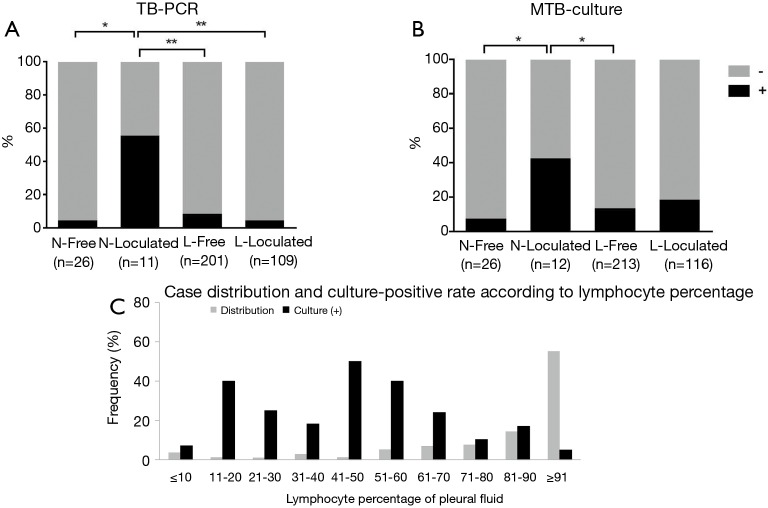
Figure 2.
Comparison of pleural fluid microbiological results (A and B) among the four tuberculous pleural effusion subgroups according to pleural fluid cellular predominance and whether the pleural fluid is free-flowing or loculated, and case distribution and culture-positive rate according to the lymphocyte percentage of pleural fluid (C). TB-PCR, tuberculous-polymerase chain reaction; MTB, Mycobacterium tuberculosis; N, neutrophilic; Free, free-flowing; L, lymphocytic. *, P<0.05; **, P<0.001.

