Figure 1.

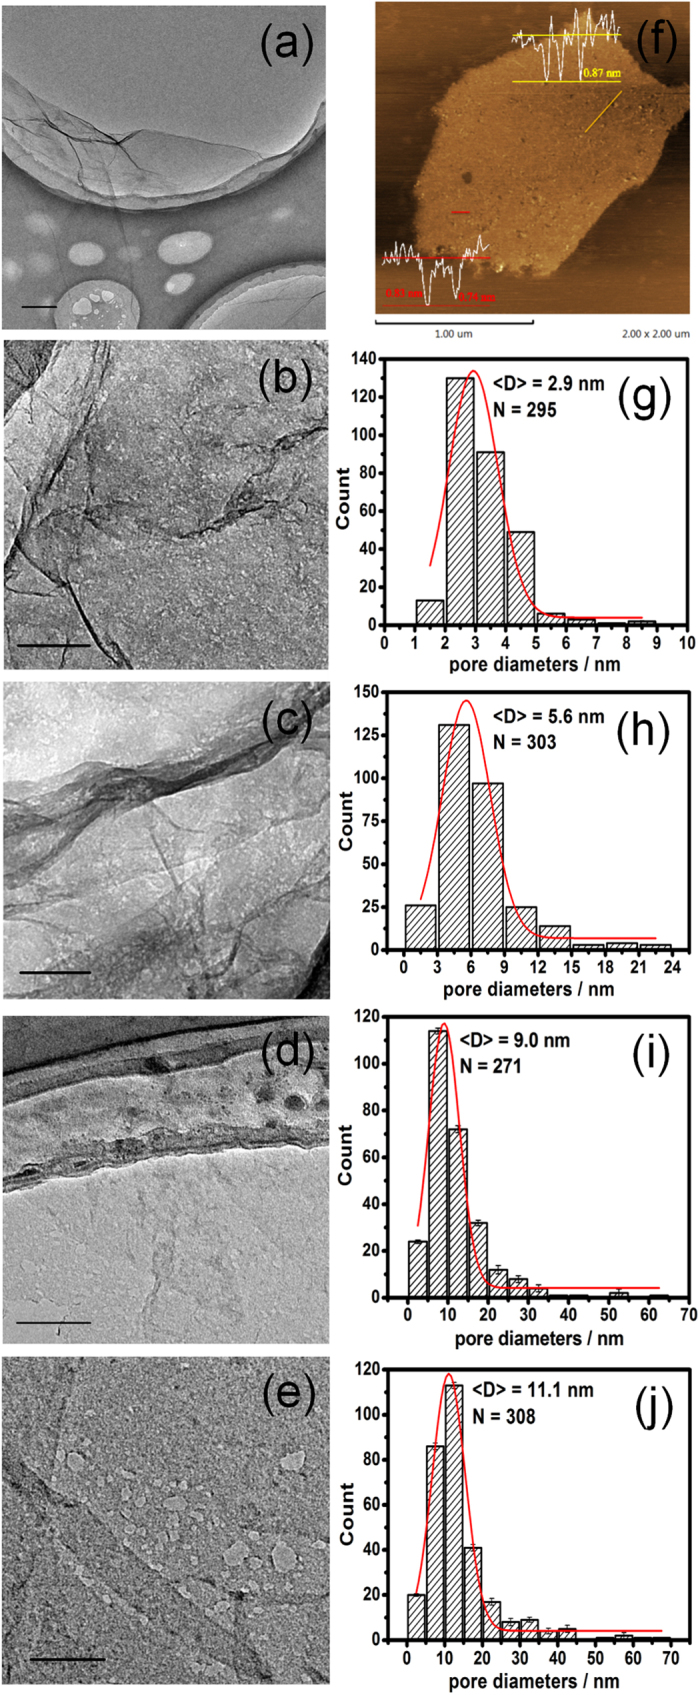
TEM images showed the evolution of GNM from GO (a) for different reaction times: 2 (b), 3 (c), 4 (d), and 5h (e). AFM image and height profiles (superimposed on the image) of GNM-4h (f). The statistical histograms combined with the corresponding Gaussian fitting of the nanopore sizes for GNMs-2, 3, 4, 5h, respectively (g–j), <D> was the mean pore size, N was the sample number. Scale bars were 500 nm in (a) and 100 nm in (b–e).
