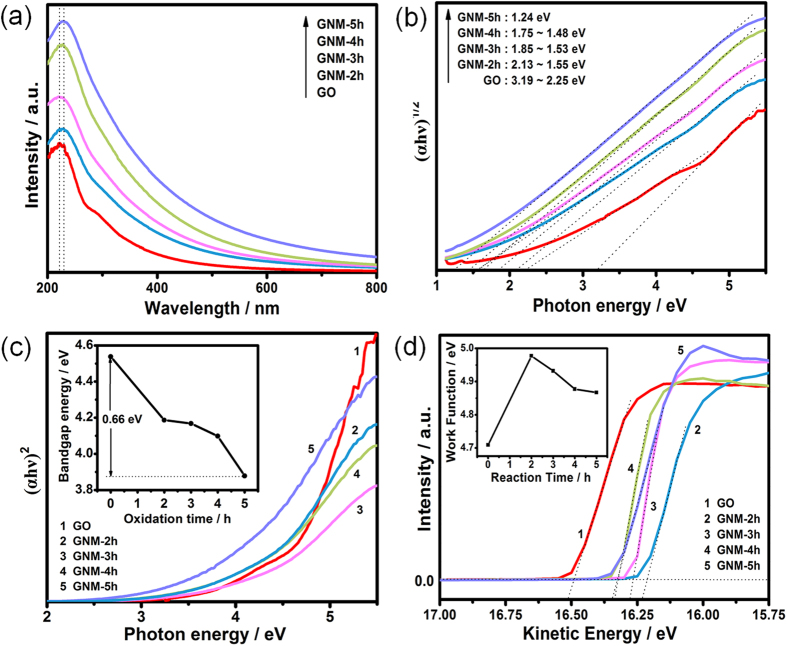
Figure 5.
UV-Vis adsorption spectra (a), plots of (αhν)1/2 against the photon energy (hν) for indirect band gap deduction (b), plots of (αhν)2 against the photon energy (hν) for direct band gap deduction and the direct band gap as a function of reaction time (inset) (c), UPS spectra in the high kinetic energy cutoff region and the work function as a function of reaction time (inset) (d) of GO and GNMs.

