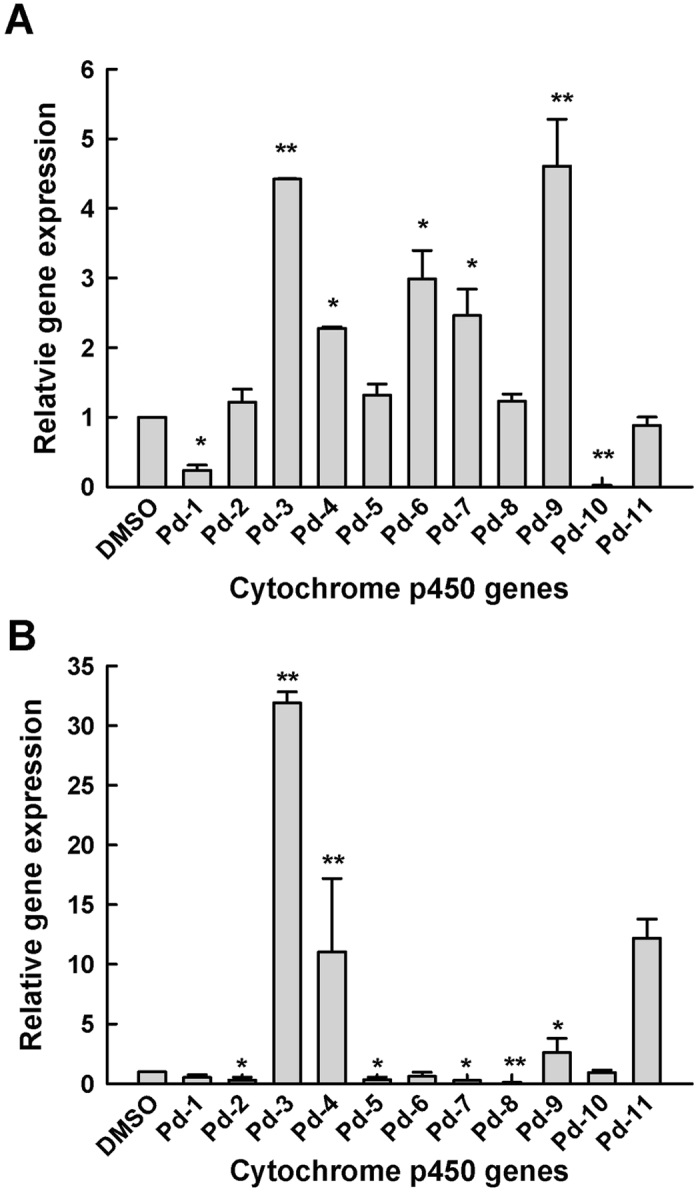
Figure 5.

Expression profile of cytochrome P450 genes in mycelia of P. digitatum (A) and P. italicum (B) grown for 5 days on PDA medium containing MP4 at 25 °C. Statistical analysis was performed using SigmaPlot software, version 8.0 (mean ± standard error, with *p < 0.05 and **p < 0.001).
