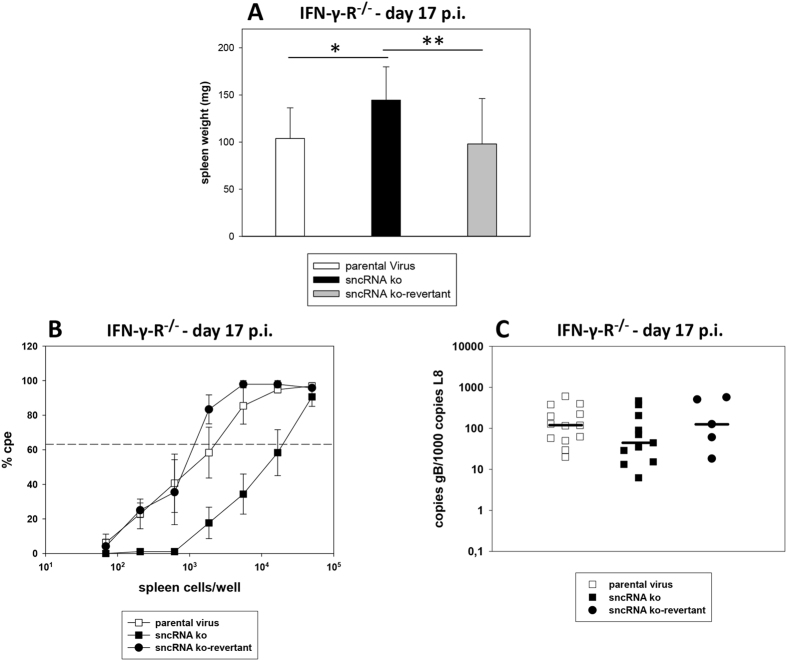
Figure 8. Early latency in the spleen of IFN-γ-R−/− mice.
Mice were inoculated i.n. with 5 × 10⁴ PFU of the indicated viruses. At day 17 after infection, spleens were harvested, and the spleen weights were taken. Single splenocyte suspensions were prepared and analyzed in the ex vivo reactivation assay or used for DNA isolation for real-time PCR analysis. (A) Spleen weights; (B) ex vivo reactivation of splenocytes; (C) viral genomic load in the spleen. Data shown in panel A are the means + standard deviations of 13 (parental virus), 11 (sncRNA ko) and 5 (sncRNA ko-revertant) mice per group, compiled from two to four experiments. The asterisks indicate a statistically significant difference: *P = 0.007; **P = 0.046 (Student’s t-test). Data shown in panel B are the means ± standard errors of the means pooled from two to four independent experiments. In each experiment, splenocytes from two to five mice per group were pooled. The dashed line in panel B indicates the point of 63.2% Poisson distribution, determined by nonlinear regression, which was used to calculate the frequency of cells reactivating lytic replication. In panel C, each symbol represents an individual mouse, and the bars represent the median. The data are compiled from two to four independent experiments.

